Blog Post
3 min read
Meetup: Real-Time Business Incident Detection with Machine Learning
Delayed business insights cost companies millions of dollars.
Data-centric companies like Web-based businesses, AdTech, FinTech and IoT face unique challenges because it is impossible to manually track the millions of metrics that are generated in today's digital businesses.
Static thresholds for seasonal data are either meaningless or cause alert-storms.
So...what can we do?
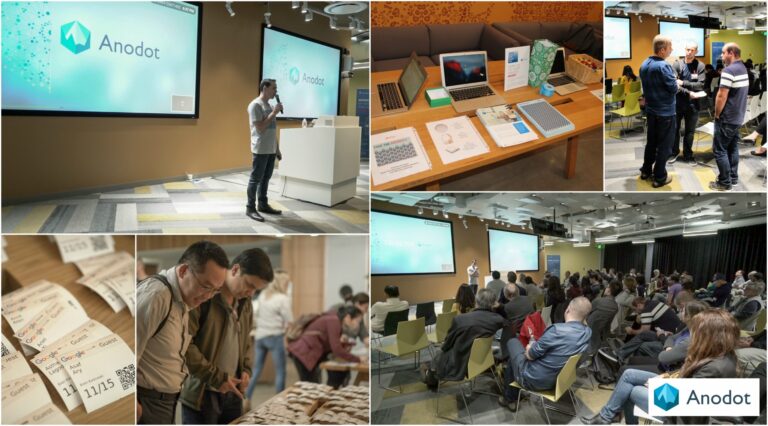
This was the discussion topic of Anodot’s first Meetup last week at the Google Headquarters in Mountain View, CA. The crowd started arriving early eager to mingle with a pizza slice in hand. Networking had officially started! The atmosphere was lively, voices echoed throughout the room. The entire Anodot US team was present and ready to socialize.
The second part of the evening was slowly approaching and the 150 Google chairs started filling up. Folks came to learn how to avoid business insight latency, and thus save $$, and we were anxious to provide the answers.
First up was Anodot’s own Uri Maoz, VP of US Business. “What is real-time business incident detection?” he asked. The crowd went wild! No...not yet. But they did enjoy Uri’s unique sense of humor and the discussion around how predictive anomaly detection can identify revenue-impacting business incidents in minutes(!) not days or weeks. Uri explored the benefits and challenges of implementing Anomaly Detection, and also shared industry benchmarks and customer case studies. Questions poured in at the end. Click here for the full Facebook Live video of Uri's presentation.
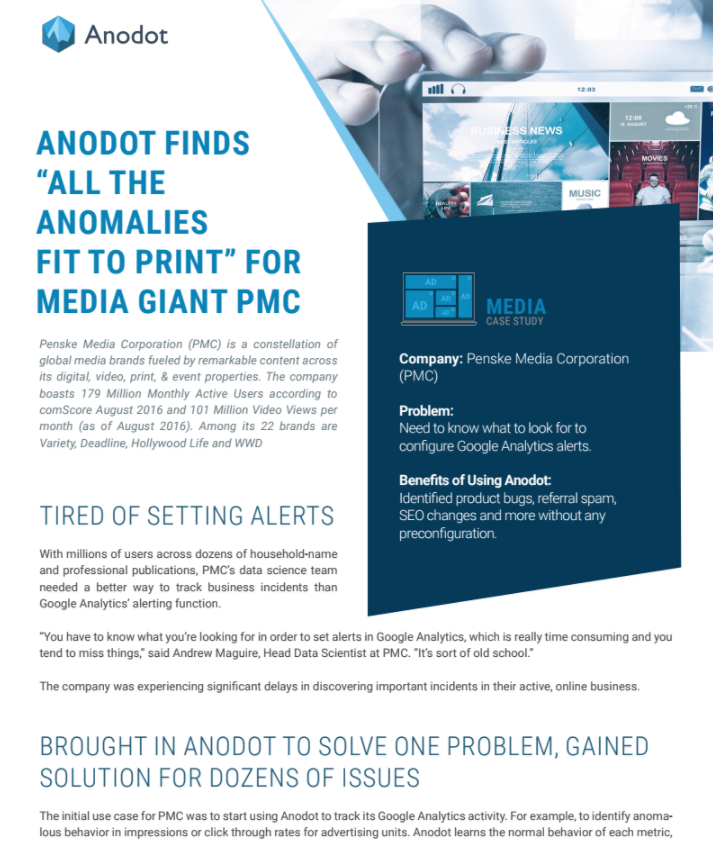
Next up was Corey Gilmore, PMC Chief Architect. He shared details about PMC challenges with gaining real time insights from Google Analytics (using current BI tools) and how these challenges can be overcome with Anomaly Detection. Click here for the full video of Corey's presentation.
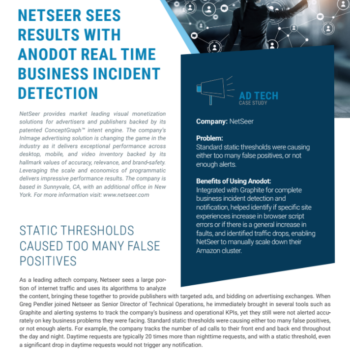
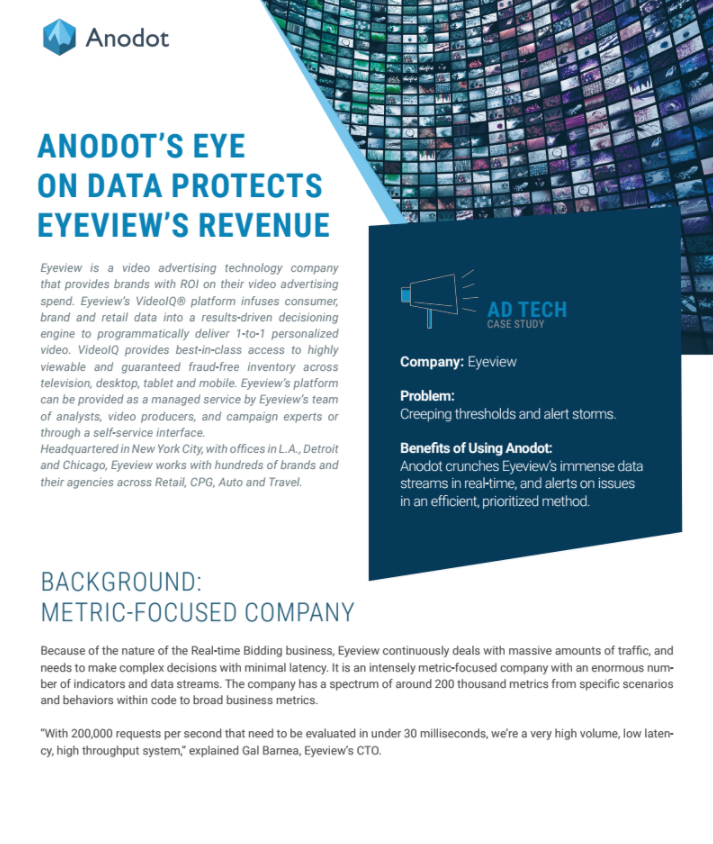
Last but not least, Greg Pendler, Sr. Director of Technical Operations at Netseer, took the stage. Greg discussed the implementation of Anomaly Detection in AdTech. Specifically, he unveiled the contribution of Anomaly Detection in analysis of business and technical data across multiple teams and how Anomaly Detection saved the company money! Click here for the full video of Greg's presentation.
Anodot’s Founder and Chief Data Scientist, Ira Cohen, was also present. He reflected on two remarks from Greg's presentation that resonated with him:
Trust in the anomalies.
and
Business (data) is where anomalies shine.
Additionally, three lucky winners walked out with amazing $150+ prizes and a smile on their face. Actually, everyone left happy. One attendee thanked us for organizing an educational event. Another attendee wrote on the Meetup page: “Made very simple to understand, got a good return of time invested.” Score!
We’d like to thank all who attended and contributed to this important discussion, our speakers who shared insights, the Google team for hosting us and @TeamAnodot for executing our first Meetup successfully! We look forward to hosting many, many more.
Cheers!
Read more