Resources

FILTERS

Resources

Blog Post 5 min read

Who owns the “I” in BI

[caption id="attachment_2542" align="alignright" width="350"] © Kate07lyn / Wikimedia Commons / CC-BY-SA-3.0 / GFDL[/caption] 
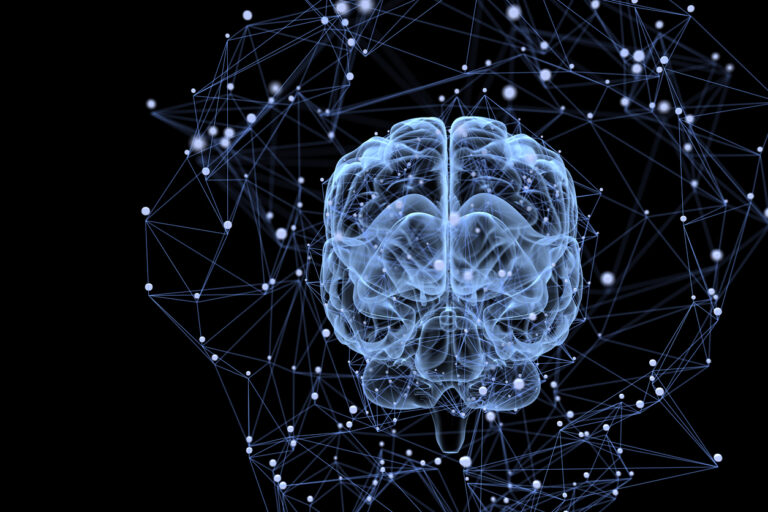
It is well known that when it comes to gaining insights from your BI system, the more granular data you have, the more accurate the insights you will gain. While most of the existing BI solutions can process and store a huge amount of data with many dimensions, they don’t offer an easy way to get the insights from the data. In fact, the BI solutions left the “I” - the intelligence - completely in the hands and minds of the data analysts. The human brain is limited to processing not more than few dozen signals, which is why you typically find organizations looking at the big picture and possibly missing issues that impact a specific segment or product because the root cause gets lost in the average. You’ve probably seen dashboards like this one with multiple KPIs to show sales figures, customer satisfaction score, churn etc. These kinds of dashboards (often called executive dashboards) are designed to provide high level visibility of different business metrics for senior management. Often, one of the KPIs will show a negative value and the data analysts will be tasked with providing explanations. It is up to the investigation capabilities of the data analyst to ask the right questions to get to the right answers that explain the shift in the KPI. This task is very time consuming and frequently feels like finding a needle in a haystack. [caption id="attachment_2543" align="alignleft" width="240"] Missing Hugh II by Little Miss no Name[/caption] I always was a big fan of detective stories, so it’s not surprising that my favorite characters are Sherlock Holmes and Doctor Gregory House. For those of you who haven’t seen the show, a typical episode of “House” begins with someone getting really sick and rushed to the hospital where he or she is referred to the diagnostic departments headed by Dr. House. This is when he fun begins… House and his team review the different symptoms and make a call on the most probable cause (It's not Lupus!) and start treatment. When the symptoms worsen, they look for more clues by searching the person’s home for toxic substances, finding out the family history, running more tests and trying a new treatment which usually fails. Eventually something unrelated triggers House to correlate the different signals with the huge amount of data he stores in his brain, a light bulb goes on and he finds the real root cause and is able to order the proper treatment which saves the person’s life. House is probably the best example of human correlation and anomaly detection, making him an anomaly that stands out as an unconventional and misanthropic genius. Imagine how the world of medicine could benefit from automating House’s diagnostic capabilities…well, with machine learning and automated anomaly detection, this day isn’t really so far off anymore. [caption id="attachment_2549" align="alignright" width="350"] PayPal's command center in San Jose, California by Kristen Fortier[/caption] Let’s take a real example from PayPal’s command center which relies heavily on multiple dashboards powered by its homegrown monitoring solution named “Sherlock” to early detect major site incidents. The Technical Duty Officers (TDOs, AKA the “diagnosticians”) constantly scan the large wall with seven big HD screens and dozens of signals to identify abnormal behavior. The PayPal monitoring system collects more than 350 thousand signals per second, and the high-value signals are displayed on the wall while the rest go to a simple alert mechanism. You can read more about this here. In case of a significant drop in volume or spike in error rate, the TDO on duty will try to figure out if this is a real issue by correlating different signals displayed on the screens. In fact, they are applying human correlation to determine if the different signals are indicative of a real issue or not. This is a time consuming process dependent on the capabilities of the person on duty, and occasionally when the signals are not that clear or strong, it can lead to a miss. This is an example of a BI solution based on visualizations that require humans to have the intelligence to make a decision based on multiple signals.  With the explosion in complexity of the environment, moving into cloud (public and private) and software designed as micro services deployed in containers, we are experiencing surge in the different signals that are collected and need analysis to gain insights. We are seeing more and more organizations face the challenge of getting real-time business insights from the enormous amount of data they collect. Data analysts simply can’t keep up with the increasing demand to crunch all the data to find ways for the business to improve its key KPIs. This reality is driving a the new paradigm of “monitoring by exception” that surfaces the most relevant anomalies so the business analysts can investigate them further. The human brain is limited in the number of data points it can process and correlate and this is exactly where the next wave of BI solutions comes in handy. With highly scalable machine learning-based algorithms, we now have software that can learn the normal pattern of any number of data points and correlate different signals to accurately identify anomalies that require action or investigation.
Documents 1 min read

Ultimate Guide to Building a Machine Learning Anomaly Detection System, Part 2 - Learning Normal Time Series Behavior

Part 2 of our Ultimate Guide to Anomaly Detection presents a general framework for learning normal behavior for time series. Can a seasonal pattern be assumed?What is the importance of modeling seasonality? Why does real-time detection at scale requires online adaptive learning algorithms? Read on to find out.
Blog Post 4 min read

Two Secrets of Swift and Scalable Anomaly Detection

Streamlining the way your digital business works – ensuring customers get what they need, conversions occur without a glitch, etc – is the goal of any company with an online presence, but it can be challenging with so many moving parts. As we discussed in a previous post, detecting anomalies is one of the best ways to make sure that everything is running smoothly and keep up with current trends. In digital businesses business, many processes happen simultaneously, and each activity may be monitored by a different person or team. Changes in different departments or even external partners can show up as an unexpected change in a totally different area, but the association might never be made if the metrics are not analyzed on a holistic level. The solution? An anomaly detection system that can understand all these different types of metrics, identify the normal behavior and alert when something has changed. When designing an anomaly detection system, there are certain principles within the design that are essential to its success. This post will give an overview of two of those secrets to success: timeliness and scale. In future posts, we’ll take a look at the other three key principles: Rate of Change, Conciseness and Definition of Incidents. How quickly do you need your anomalies detected? In anomaly detection, there are two types of decision making. First, detection can be done in non-real-time, meaning that the results are retroactively seen by the user. In this case, the anomalies are used for a retrospective analysis of what happened, which helps in making decisions about the future. The other option is real-time detection, where you see the results of metrics as they happen. When would you want non-real-time decision making? This model is useful for long term planning. Basically, the data received and understood is not relevant to the immediate situation of the company, and is not necessary for immediate action. An example of when you might use non-real-time decision making is when reviewing data from marketing campaigns to plan future strategy, scheduled maintenance, budget planning, etc. In this situation, data is collected over a period of time, and when that period finishes, a batch machine learning algorithm can be used to find out what anomalies occurred during the set amount of time. While viewing these results in non-real-time, your business can see the results of a longer course of action and thus make non-urgent decisions for future action. However, most online businesses are in dire need of real-time decision making. For example, sudden spikes or dips in purchases could present opportunities for action that would generate more sales. Knowing exactly what is going on with your digital business at the moment that it is happening enables you to take advantage of real-time trends for the furtherance of your business goals. Online machine learning algorithms are the best way to process data in real-time. Using these algorithms also helps in our next point. Scaling for Growth Online machine learning algorithms are easily scalable, thus making them ideal for large data sets. However, online machine learning algorithms are not without their faults. They tend to be more prone to false positives. If your company is continuously growing, then scalability is a valid concern. Thus, online machine learning algorithms are still the best option for businesses that have more metrics and large data sets. There are ways to reduce false positives, which we discuss in our White Paper “Building a Large Scale, Machine Learning-Based Anomaly Detection System, Part 1: Design Principles.” Conclusion Online machine learning algorithms are a viable solution to the needs of businesses in the digital age. As we’ve explained, real-time decision making and ability to scale are two of the secrets of building a successful online machine learning anomaly detection system. For more information about the design principles of an anomaly detection system, read the full white paper: Building a Large Scale, Machine Learning-Based Anomaly Detection System, Part 1: Design Principles.
Videos & Podcasts 19 min read

Publishing Company PMC Applies Anodot's Anomaly Detection on Their Google Analytics Data

Corey Gilmore, Director of Data and Analytics at PMC, a large publishing company, presents how they identify anomalies in their Google Analytics using Anodot.
Blog Post 4 min read

Beyond the Average: Uncovering Hidden Insights with Granular Monitoring

Most organizations monitor and report the overall availability of their site or service. Here is an example of how Facebook reports the status of their API availability on their developers’ site. This error rate represents 99.978% availability, which is fantastic! But what if it means that this is a result of one of the following scenarios: 100% failure on android Jelly Bean 4.2.x 25% failure for a new promising startup that is integrating with Facebook’s authentication services Facebook’s DAU (Daily Active Users) hit 1.18 billion according to their last earning report (Q3 2016); if we assume that each user represents only 1 API call per day, that means  259,600 API calls fail daily. And that means 259,600 users experience failed interactions. How can we find the common dominator for those interactions to find the root cause and fix it?  Which API has the most errors? In which region? On which browser? When we average things out, we lose visibility of the underlying root cause that impacts the metric we are measuring, be it availability, transaction volume or conversion rate. It’s like the statistician’s joke: “Then there was the man who drowned while crossing a stream that was, on average, six inches deep.” Most organizations look at the big picture and act only when there is a significant change to one of the key metrics. But the fact of the matter is that the business impact of many small events over time (figure 1) can be the same or worse than one short major incident (figure 2).   Average Monthly Availability: 99.85% Impact Start: 0:14 Restore: 0:50 TTR: 36 minutes Average Hourly Availability: 59.5% Average Daily Availability: 98.22% Average Monthly Availability: 99.85% There are few constraints that drive organizations to take a high level look at metrics: Technology: Until recently, technology didn’t support the level of granularity required to monitor the health of individual transactions. Dashboards can’t scale for more than a few dozen signals and setting up alerts at a granular level (e.g. customer, partner, city) was not supported due to performance and scalability challenges. Human brain: Even if we could provide multiple dashboards with hundreds of different signals, the human brain is not equipped to process all of them and definitely not equipped to correlate the different signals to find the root cause of an issue. When a popular ride sharing startup was in its earliest stages, a critical partner integration would break occasionally and go unnoticed for hours.  Once the problem was detected, the startup’s dev ops would have to call the account manager at the partner company to have the issue fixed. The partner, with millions of merchant integrations, simply could not monitor the health of each integration, therefore compromising by looking at enterprise level KPIs (maturity level 1 for detection and 5 for collection). Four years later, the ride sharing startup became one of the partner largest customers with a huge volume of traffic. The startup didn’t stop working with the partner mainly due to personal relationship - but what if they had? How many other customers didn’t have the same personal relationship with the partner company and moved their business somewhere else? The only way to solve this issue and get insights on a granular level is by embracing new machine learning and anomaly detection technologies that can process huge amounts of data in real time and surface anomalies on an indefinite number of dimensions. This enables the shift to a new paradigm, BI 2.0, in which machine learning is used to gain deeper insights into business metrics and automated correlation enables faster root cause analysis. If this sounds familiar, you should consider implementing an anomaly detection solution to see how many insights are hidden in your data. I know that you might think that you need to hire data scientists to implement such a solution but the reality is that it is much easier than you might think. Take advantage of advanced anomaly detection products that automates the entire process.  All you need to do is push your metrics and uncover the hidden insights.
Videos & Podcasts 15 min read

Adtech Company NetSeer Leverages Anomaly Detection to Improve Efficiency

Greg Pendler of Netseer presents how his Adtech company is using Anodot to identify anomalies in real time, to keep their business working efficiently.
Blog Post 3 min read

Why Anomaly Detection is the Next Big Thing for Digital Business

In today's competitive market, digital businesses such as fintech, ad tech, media and others are always on the lookout for the next big thing to help streamline their business processes. These businesses are constantly generating new data and often have systems and people in place to monitor what is going on. For example, within one company, you might find an IT group monitoring network performance while someone in product management watching page response time and user experience while marketing analysts track conversions per campaign and other KPIs. It is no secret that anomalies in one area often affect performance in other areas, but it is difficult for the association to be made if all the departments are operating independently of one another. In addition, most of the available tools for this type of monitoring look at what has happened in the past, so there is a built-in delay between when something important happens, and when it may (or may not) be discovered via the monitoring process. Each business incident discovered could be an opportunity to save money, plug a leaky funnel, or to potentially create new business opportunities. In an ideal setting, a large-scale business incident detection system would take a holistic approach to anomaly detection, and do it in real time. Monitoring and analyzing these data patterns in real-time can help detect subtle – and sometimes not-so-subtle – and unexpected changes whose root causes warrant investigation. The graph below illustrates an e-commerce company that sees an unexpected increase in the number of gift cards purchased online while simultaneously experiencing a drop in the revenue expected for the gift cards. By correlating the two anomalies, we understand that there has been a price glitch that could cost the company a lot of money if not caught and addressed quickly. [caption id="attachment_2402" align="aligncenter" width="1320"] Price glitch that could cost ecommerce a lot of money[/caption] As a business grows, more and more incidents can go undetected unless an anomaly detection system is directed to make sense of the massive volume of metrics. Not every metric is directly tied to money—but most metrics are tied to revenue in some way. Today, most companies employ manual detection of anomalous incidents by creating a lot of dashboards and monitoring daily or weekly reports or by setting upper and lower alert thresholds for each metric. These methods leave a lot of room for human error and false positives or missed anomalies. To find out how to leverage automated anomaly detection, where computers look at this data and sift through it automatically and quickly, to highlight abnormal behavior and alert on it, check out our White Paper: Building a Large Scale, Machine Learning-Based Anomaly Detection System, Part 1: Design Principles.      
Videos & Podcasts 0 min read

Game Wisdom Podcast: Anodot's Ira Cohen Discusses Company's Impact on Mobile Development

Josh Bycer from Game Wisdom sat down with Anodot's Ira Cohen and Rebecca Herson to discuss how things are changing with the mobile market, and the work Anodot is doing in the field of analytics.
Documents 1 min read

Part 1: Ultimate Guide to Building an ML Anomaly Detection System - Design Principles

The first in our 3-part guide to anomaly detection covers the components necessary to designing a machine learning-based anomaly detection system.