Anodot Resources Page 46

FILTERS

Anodot Resources Page 46

Blog Post 7 min read

Transaction Metrics Every Fintech Operation Should be Monitoring

Fintech Metrics: Critical Transaction KPIs to Monitor In a previous post about payment transaction monitoring, we learned how AI-based payment monitoring can protect revenue and improve customer experience for merchants, acquirers and payment service providers. In this post, we’ll highlight the critical transaction metrics that should be monitored in order to achieve these goals. When most organizations think about ‘transaction metrics’ they probably think the KPIs are only relevant to BI or analytics teams. Measuring and monitoring payment metrics and other data doesn’t take priority in running the daily affairs of Fintech operations. Or does it? What if we told you that the opposite is true. If Fintech companies want to protect revenue, payment operations teams must be able to find and fix transaction issues as they’re happening. In an increasingly digitized and competitive environment, no one can afford to wait for periodic reports to provide the necessary insights to run and optimize their daily operations. It’s time for data to be approachable and understandable to all business units, and we’ll explain why in this post. Read on to discover how to improve transaction metrics monitoring to meet the challenges that lie ahead - or on your table right now. Using transaction data proactively Transaction processing metrics are significantly more complex to monitor than most digital metrics like web traffic or engagement. On top of the financial responsibility and risks, teams are dealing with heightened operational complexity. Just think how many steps are necessary for a single transaction on your site and how many parties are entangled. Many stages require verification, authentication, and approval. It’s never just a click. With so many intersections and points of friction, there’s a lot that can potentially go wrong. A glitch in any of the related algorithms, APIs, or other functionalities can cause chain reactions in a whole series of processes and immediately lead to reduced customer satisfaction and eventually to a loss of revenue. It also means there are many opportunities to optimize processes and increase efficiency. At each link in the chain, there’s something to improve. To make both possible - detect failures and opportunities - it’s critical to monitor the entire set of digital payment metrics. Currently, that’s in the hands of the BI or IT teams. Operational teams depend on standardized reports of historical data after it passes through the relevance filters of the data analysts. You may be missing specific transaction metrics that could provide a valuable understanding of how consumers behave or point towards weaknesses in the operational processes. You are definitely losing time when it comes to identifying failures. Why organizations need more granularity for payment metrics 
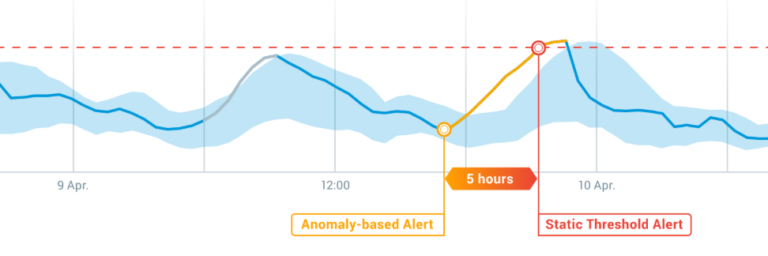
The amount of data and metrics to monitor has become overwhelming even for the dedicated business units. There are only so many dashboards a human being can observe. To remain efficient, they currently focus on critical business metrics and generalized data. Alert systems notify about irregularities based on manually set static thresholds, causing alert storms when there are natural fluctuations. Let’s imagine transaction performance metrics show a decrease, and the data you receive helps you identify a reduced payment approval rate. That’s still a pretty general observation that creates more questions than answers. A more granular view of the data, such as by location, vendor, payment method, device, and so on, could deliver insights that point you towards the cause. The same is true for optimization efforts. With a deeper level of granularity, companies can pinpoint weaknesses and strengths more precisely and act upon them with a higher chance of success. You can easily identify your highest-performing affiliates or discover the geographical locations you are most popular in. [CTA id="7a3befd2-2d16-4944-af32-574e0a11e90d"][/CTA] Revenue-critical KPIs to monitor Because there are so many metrics and dimensions to measure across the payment ecosystem, it’s important to focus on the most critical KPIs. Fintech operations teams should make sure they have accurate and timely insight into the following metrics: Payment approval - compare payment requests vs. payments approved. With Anodot you can identify discrepancies on the spot and reduce the time to identify and fix issues. Merchant behavior - measure the number of transactions, financial amounts, and more. Anodot lets you analyze merchant behavior and uncover ways to optimize marketing and business. Vendor routing - evaluate your payment providers. Anodot helps you focus your efforts on the strongest vendors. APIs - nothing goes without functioning APIs in fintech. With Anodot you can easily monitor the functionality and ensure smooth processes. Deposits and settlements - monitor the two layers for payment. Use Anodot to stay on top of the entire payment process and increase efficiency. Processing intervals - keep an eye on the time it takes for payments to go through. With Anodot you’ll know right away when there’s a delay somewhere in the system and can avoid customers being disappointed and abandoning your site. The benefits of real-time payment metrics The problem with the current method of analyzing transaction metrics analysis is that data is historical, too generalized, and not effectively prioritized. In other words, by the time the information reaches you, it already belongs to the past. Strictly speaking, decisions are based on outdated information. Real-time data enables you to see and react to what’s happening right now. That may not sound all that beneficial at first. Some people even find the thought of having to respond in real-time stressful. But monitoring real-time data doesn’t mean you sit around watching your data monitor like a flight supervisor. Back to the payment approval issue; The tool correlates out-of-the-ordinary data behavior and finds related incidents in real-time. Instead of you - or a data person - digging up possible related metrics and creating reports to see what caused the drop, the tool points you towards the cause and the solution. How AI makes data accessible to more business units Anodot’s AI-driven business monitoring tool learns normal data behavior patterns, taking seasonal changes and fluctuations into consideration to identify anomalies that impact business. Anodot monitors all your business data and learns the behavioral patterns of every single metric. The monitoring goes on even when you are not looking, distilling billions of data events into single relevant alerts. Anodot also correlates irregularities in transaction metrics with other data and notifies the relevant business units. This means, when you receive an alert, it contains maximum information to help you get to the bottom of what’s happening and how things are connected. Let’s say you detect a drop in deposits. Anodot correlates all related metrics and identifies that all activities with a specific vendor are down, so the failure is with that particular vendor. You are a huge step closer to the next phase of problem-solving. Anodot also prioritizes and scores the severity of an alert based on its financial impact. You only get notified about the metrics that are relevant and need immediate attention. Autonomous payment metrics monitoring for higher efficiency Only an AI/ML-based solution that autonomously monitors all metrics, correlating and prioritizing data, can ensure that each business units receive the insights they need when they need it. The days where data was the sole domain of a chosen few are over. In today’s digitalized business environments, data is everywhere and needs to be accessible to those who need it most. Monitoring data is part of a daily routine, just like keeping an eye on the fuel gauge in your car to know when you need to refill.
Blog Post 3 min read

Why Every Company Needs DataOps

Companies produce, collect and manage massive amounts of data Recently in TechBullion, Anodot’s CEO, David Drai, addressed the question, ‘Why Every Company Needs DataOps’ With DevOps, IT was finally recognized as the strategic advantage that the business needed to beat the pants off their competition. Companies now deploy code tens, hundreds or even thousands of times per day, while still delivering unsurpassed stability, reliability and security. DevOps isn’t foolproof Drai expands by saying: “I can cite hundreds of major and expensive incidents that even DevOps couldn’t protect businesses from facing.” More and more, organizations have come to the realization that DevOps is just a part of the solution for maintaining reliable business performance. Where does DevOps Fall Short? While DevOps plays a key role in minimizing the friction between development and production, BI teams see a similar struggle with between backroom and front room developers. The challenge is in closing the gap between these two areas. Drai wrote, “Devops understands monitoring without a holistic understanding of the business and its granular data.  On the other end of the spectrum are BI and data teams that do have a nuanced understanding of business data, but are lacking in tools for around-the-clock monitoring and alerting to abnormal behavior of the data.” What is DataOps? Companies rely on data from a variety of different sources, helping them to gain a better understanding of customers, products, and markets. Explained Drai, “an entirely new role is needed: DataOps.  Because of the dynamic nature of data and the constant new services, partnerships, and products entering the market every quarter, the DataOps role is ongoing and should comprehensively understand and use the proper tools to monitor the ebb and flow of company data including business anomalies, trend changes, changes in predictions, etc.” Why not traditional BI role? How does DataOps differ? The skills gap will not be found in traditional BI strategies. The DataOps role will fill growing gap by working with data across the organization and uncovered a better ways to develop and deliver analytics. “As the focus of DataOps is to monitor and understand all company data, there is a strong existing link between this role and existing company roles like BI analysts and data engineers,” Drai emphasized, “Each role is unique enough to stand on its own, and all three should be reporting to a Chief Data Officer, a position that is becoming increasingly prevalent in data-driven companies.” Next Step See the full article on TechBullion: From DevOps to DataOps : Why Every Company Needs DataOps  
Documents 1 min read

ANALYST REPORT: No more Silos - How DataOps Technologies Overcome Enterprise Data Isolationism

This new report from Blue Hill Research takes a closer look at how enterprises deploy DataOps models to establish the free flow of data within their organization. It includes real-world case studies which demonstrate how organizations in various industries from retail and ecommerce to education are leveraging new technologies to break down silos.
Documents 1 min read

WHITE PAPER: The Essential Guide to Time Series Forecasting, Part II - Design Principles

Learn the key components and processes of automated forecasting, as well as business use cases, in this 3-part series on time series forecasting.
Blog Post 5 min read

Could AI Analytics Have Instantly Caught Equifax Data Breach?

Unchecked Vulnerability Leaks Information on Millions The headline was almost too big to believe. On Sept 7, The New York Times announced, “Equifax Says Cyberattack May Have Affected 143 Million in the U.S.” This meant that personal credentials, like Security numbers and other data, for almost half the population of the United States was leaked to hackers. The Verge added, “It has been marked as the worst data breach in US history.” As the picture becomes clearer, the issue at stake was a vulnerability in one of the plugins in the Apache Struts framework. Former Equifax CEO Richard Smith said. “It was this unpatched vulnerability that allowed hackers to access personal identifying information.” This week, in Congressional testimony, The Guardian reported, “It’s like the guards at Fort Knox forgot to lock the doors and failed to notice the thieves were emptying the vaults,” Greg Walden, the chairman of the House energy and commerce committee, told Smith. “How does this happen when so much is at stake?” Walden said. “I don’t think we can pass a law that fixes stupid.” The question arises, if Equifax had an AI-powered analytics solution that tracked anomalies in real time,  would this have surfaced the hack immediately, giving the company plenty of time to respond, and thwart any damage? What happened with Equifax? Equifax is one of the three major consumer credit reporting agencies. The company reported on September 7th that hackers had gained access to company data that potentially compromised sensitive information for 143 million American consumers, including Social Security numbers and driver’s license numbers, posing serious repercussions for identity theft. Dan Goodin reported in Ars Technica “The breach Equifax reported Thursday, however, very possibly is the most severe of all for a simple reason: the breath-taking amount of highly sensitive data it handed over to criminals. By providing full names, Social Security numbers, birth dates, addresses, and, in some cases, driver license numbers, it provided most of the information banks, insurance companies, and other businesses use to confirm consumers are who they claim to be.” While still unclear who was behind the attack, with some conjecturing that this was a state-sponsored attack, the data could now be in the hands of hostile governments, criminal gangs, or both and will stay there indefinitely. This leaves over half the population of the US’s vital identifying information exposed. Even worse, while the leak occurred in the spring, the company only went public in September. “The fallout has been swift, with government agencies looking into the incident, class action lawsuits being filed, and consumers demanding free credit freezes.” Why did so much personal data get leaked from Equifax? Cybercriminals exploited a security flaw on the Equifax website. Brian Krebs reported on KrebsonSecurity how the criminals did it. "It took almost no time for them to discover that an online portal designed to let Equifax employees in Argentina manage credit report disputes from consumers in that country was wide open, protected by perhaps the most easy-to-guess password combination ever: “admin/admin.” Looking deeper into the hack, Blogger and admin for SPUZ said, “I asked the hackers one last request before disconnecting. I asked, "How did you manage to get the passwords to some of the databases?" Surely the panels had really bad security but what about the other sections to them? Surely there was encrypted data stored within these large archives no? Yes. There was. But guess where they decided to keep the private keys? Embedded within the panels themselves.” Equifax has confirmed that a web server vulnerability in Apache Struts that it failed to patch months ago was to blame for the data breach. DZone explains how this framework functions. “The Struts framework is typically used to implement HTTP APIs, either supporting RESTful-type APIs or supporting dynamic server-side HTML UI generation. The flaw occurred in the way Struts maps submitted HTML forms to Struts-based, server-side actions/endpoint controllers. These key/value string pairs are mapped Java objects using the OGNL Jakarta framework, which is a dependent library used by the Struts framework. OGNL is a reflection-based library that allows Java objects to be manipulated using string commands.” How could AI-powered Analytics have made an impact? This situation could have been reacted to much faster had the right real-time business intelligence services been integrated into their systems. Approaches like this, such as Anodot’s AI-powered Analytics solution, correlate a company’s raw data to quickly identify anomalous behavior and discover suspicious events in real time, before they become crises. Once an issue is detected technical teams are alerted, so they can resolve issues before they unravel. Companies need to know what their data can tell them right away in order to fix costly problems. Working at the scale of actively monitoring thousands or even millions of metrics, you need an AI-powered analytics solution, with automated real time anomaly detection. Had Anodot’s AI-powered analytics been in place, it could have tracked the number of API Get Requests for user data, and noticed an anomalous spike in requests, catching the breach instantly, regardless of the existing vulnerabilities.
Documents 1 min read

WHITE PAPER: The Essential Guide to Time Series Forecasting, Part III - System Architecture

Learn the key components and processes of automated forecasting, as well as business use cases, in this 3-part series on time series forecasting.
Blog Post 4 min read

Forbes: Anodot Makes General-Purpose AI Possible

Is General Purpose AI Possible? Recently in Forbes, Dan Woods raised the question, ‘Has Anodot Defined the Principles of General-Purpose AI?’ With the rise in attention to Artificial Intelligence (in all its forms), one of the biggest problems that has come up is: knowing when to apply which type of AI to which problem. Woods explained that he has defined a set of principles that can explain when general purpose AI is possible. Can AI Software Really be Good at Everything? So what is general purpose AI anyways? The author established that general purpose AI must be able to solve problems in a wide variety of use cases, be usable by someone who doesn’t really understand the science behind the AI, and should be easy to connect to a business domain. Yet in addressing the practicality of actually applying general purpose AI, the author asserted, "when someone claims their AI is good at everything, it’s usually not that good at anything." While skeptical, he held that one of the main criteria for a successful implementation of general purpose AI would be that the solution can address many business use cases. Ready to Test the General Purpose AI Hypothesis? Woods explained how Anodot’s approach not only peaked his interest, but also intrigued him for how this could test his criteria for realizing general purpose AI. He wrote, “What’s particularly interesting about Anodot (and what makes it more of a general AI product) is that it is data agnostic. Users feed in their data and it helps to diagnose a problem, but it does this without any context – it doesn’t understand the meaning of your data. So, for instance, it doesn’t need to differentiate between sales or social media data to produce a result. It also can process any kind of data, from structured to non-structured.” What’s Anodot’s Secret Sauce? Most traditional analytics solutions may have good collectors (mainly for infrastructure metrics), but fall short when it comes to accurate detection and alerting, with the inevitable result: many legitimate anomalies aren’t detected and too many false positives are reported. Anodot is an Artificial Intelligence analytics solution that finds subtle issues lurking in the data and proactively identifies business incidents in real time. Using an ensemble approach to identify as many anomalies as possible within a given dataset, Anodot runs many algorithms, constantly refining its detection ability while receiving feedback from the user. Its pattern recognition algorithms are designed to detect anomalies in time series data, making it data agnostic. Anodot detects legitimate anomalies with fewer false positives – allowing organizations to remedy urgent problems faster, and capture opportunities sooner. Data-driven Organizations Need Real-Time Business Incident Detection While there are many AI systems in the market that try to find events and data that is not normal, they often fall short. The author asserted, “often these systems fail because they identify too many anomalies (false positives) or not enough (false negatives).” Anodot’s approach differs from other systems, and is ready to match the scale and speed required  by data-driven organizations. “Once these anomalies are identified, a second level of AI evaluates the anomalies, assigning them a score and to correlate them. By using a weighted scale, Anodot tries to surface only major incidents, filtering out low-impact anomalies.” While comprehensively discovering all anomalies, Anodot may not know what the anomalies are and why it could be important that the failure of one component to function impacts the performance of an app. Anodot brings this information to the attention of the user, highlighting a correlation between the two issues. The person using Anodot can quickly turn this information into valuable insights. “This is the key to general purpose AI,” wrote Woods, “The person doing the searching can quickly discern relationships between the anomalies. The model of the anomalies doesn’t have to be captured in the system.” Read the full article on Forbes: Has Anodot Defined the Principles of General-Purpose AI?
business analytics in 2020
Documents 1 min read

The Modern Analytics Stack

A brief overview of the components of today's AI-driven analytics stack, and how they compare to their traditional counterparts. This white paper also surveys the leading solutions for each component.
Blog Post 5 min read

5 Fatal Flaws of CEO Dashboards that Derail Leadership and Decision-Making

The claim for most CEO dashboards is that they provide  a complete view of enterprise performance and reliable, real-time information. Yet, if you’ve ever taken the time to read about building the perfect CEO dashboard, you might remember time-consuming tips and tricks explaining which metrics to include in the data monitored by the dashboard, and how that data should be presented. This first step - the selection of which metrics to include - is the fatal flaw of CEO dashboards, because it’s the first opportunity for those who rely on them to miss  critical information. Fatal Flaw #1 CEO dashboards lack intelligent correlation Looking for new business insights and intelligence, and choosing which metrics to include is more art than science.  No one knows the answers to questions that haven’t been asked yet. An important actionable insight can be present in any metric, and why they should all be monitored. More importantly, insights are often only found through correlation of various metrics. One of the keys to making data actionable in any organization is being able to see the whole picture. CEO dashboards often fail to provide all of the necessary information you need to make informed decisions.  These missing links of data can delay a decision, or lead to misinformed decisions, which can be detrimental to your organization. Even if all necessary information is being gathered, it can’t present a coherent picture.  With CEO dashboards, you’re forced to guess what’s important enough to be given the limited real estate on the dashboard. Correlating and acting on this data takes time and manpower, and for larger organizations with a lot of business activity this can add up significant amounts of time before actionable data is consolidated and, if possible, rendered usable. Fatal Flaw #2 Only shows how actual performance meets business goals, but not why CEO dashboards can only indicate how well your company’s actual performance meets your business goals, but can’t show why. If you are lucky enough to benefit from a string of beneficial business events outside your control (social media buzz causes a spike in orders, a competitor suffers a brand-damaging PR mistake, etc.), you won’t ever know that, and more importantly, might get caught unable to respond when that spike hits. Without granular real-time metrics, you won’t connect the cause to the jump in orders. Actionable insight of what caused the spike in orders would allow you to organize enough inventory to respond to the demand, and try to further leverage the buzz for more growth. Fatal Flaw #3 Wasting time driving down the wrong road A CEO dashboard, however, won’t indicate social media buzz until all the hype has died down, if it shows at all. Harvard Business Review  explained that “…dashboards are poor at providing the nuance and context that effective data-driven decision making demands.”  When the bump is over and the top-level KPIs settle back down to normal, you may be identifying a problem to explain the decrease, instead of searching for to leverage the increase – now a lost opportunity. This results in lots of wasted time looking for the wrong root cause, clouding decision-making and leaving your company vulnerable to a competitor’s agile maneuvering. There’s a real cost to relying on dashboards to untangle the correct causation behind a discovered incident. It can even lead to mistaken conclusions, like how a GPS upgrade increased car accidents when it actually significantly decreased them. Fatal Flaw #4 CEO Dashboards don’t provide intelligent prioritization Collecting thousands of events or alerts every minute from your applications and infrastructure, and presenting that data in a dashboard isn’t analytics. The dashboard may look sexy and have beautiful widgets. Users apply filters on this data, performing their own analysis and work. Deriving intelligence from data shouldn’t require an end user to define what to look for, or where, or what are the most critical KPIs, or what normal or abnormal is. This is not intelligence because a user is telling the dashboard exactly what data to show. Fatal Flaw #5 Relevance - interpreting a dashboard a thousand ways CEO Dashboards fail to properly incorporate all of the relevant data sources necessary to make a truly informed, real-time decision, and critical information may not be displayed quickly or effectively enough to act upon.  A single data signal can be both a strong insight for one person and just more noise for another. There’s a level of subjectivity when it comes to the relevance of data. In order to be relevant, data needs to be delivered with the right context, correlation and association. If data isn’t packaged well for decision makers then it will not be acted on. If insights are trapped in a dashboard tool that managers are too overwhelmed to access or the data is delivered too infrequently to use, then the insights may never be found. In business, leaving data up to interpretation can be risky and costly. CEO dashboards belong in the rear-view mirror Business strategy is only effective if you possess the appropriate intelligence and agility to outmaneuver your competition. Dashboards aren’t going to provide insight fast enough when hundreds of thousands of dollars are lost per hour due to a pricing glitch on an ecommerce site, no matter what color scheme, chart type or font is used. Businesses need real time insights This is why CEOs should abandon these dashboards, and turn to an AI analytics platforms to find all the opportunities in your data.