Blog Post
7 min read
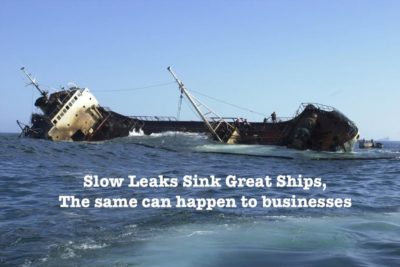
A Small Leak Can Sink a Great Ship: Proactive Monitoring Keeps You Afloat
Small and slow leaks sink ships - by analogy, slow and small leaks can also cause significant losses for any business if not detected and fixed early.
Read more