Case Studies
4 min read
Payment Platform Uses Anodot to Ensure Seamless Customer Experience
Payoneer's payment platform streamlines global commerce for more than 5 million small businesses, marketplaces, and enterprises from 200 countries and territories.
Leveraging its robust technology, compliance, operations, and banking infrastructure, Payoneer delivers a suite of services that includes a cross-border payments, working capital, tax solutions, and risk management. Airbnb, Amazon, Google, WalMart and Rakuten are among its many customers.
With millions of financial transactions happening on its platform 24x7, Payoneer closely monitors 190,000+ performance metrics in every area across the company. They are watching for any indication that something is off kilter with the business — for example, an unexpected decline in people registering for a new account, or a glitch in an API with third party software — in order to address issues quickly.
Anodot helps Payoneer stay on top of its business through timely anomaly detection of various metrics and highly accurate forecasts for currency distributions. Here are a few examples of how Payoneer uses Anodot:
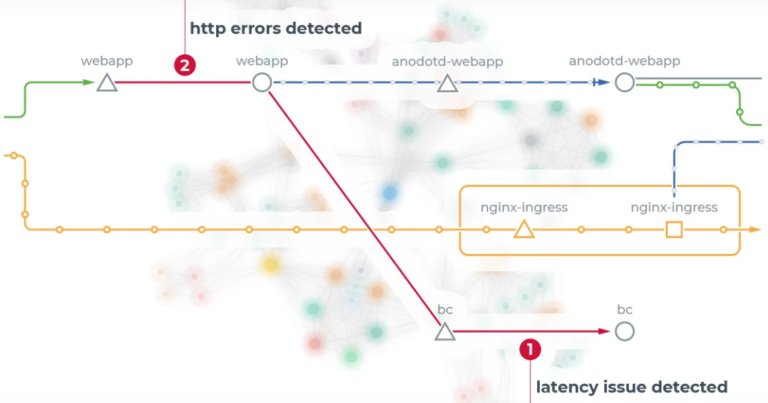
Log Analysis to Quickly Spot Issues
Yuval Molnar is Senior Director of Production Services at Payoneer. His group created an integration between the Coralogix log analysis platform and Anodot for autonomous anomaly detection. The metadata from every service Payoneer has — now some 1,000+ services — goes into Coralogix and then is fed into Anodot to look for anomalous behaviors within the logs.
Using Anodot, Payoneer has been able to increase time to detect critical incidents by 90% and increase visibility into payment operations 3X.
"Now we have a monitor in place that checks anomalies in terms of number of errors or number of logs, which is awesome," says Molner. "This is something we didn't have before and it's a game changer because we completely eliminated false positive alerts and vastly accelerated time to detection of real problems."
Spotting Trends in Customer Care
Payoneer monitors the types of calls coming into its customer care team. Every time a customer calls the care center, the service agent logs the subject and the sub-subject of the reported issue. From time to time, there is a trend where the call center is getting a lot of complaints about a specific subject.
With Anodot, service agent reports are fed into the system. If there is a trend where a particular issues is increasing in frequency, Anodot will automatically product an alert in order to get the issue remediated quickly.
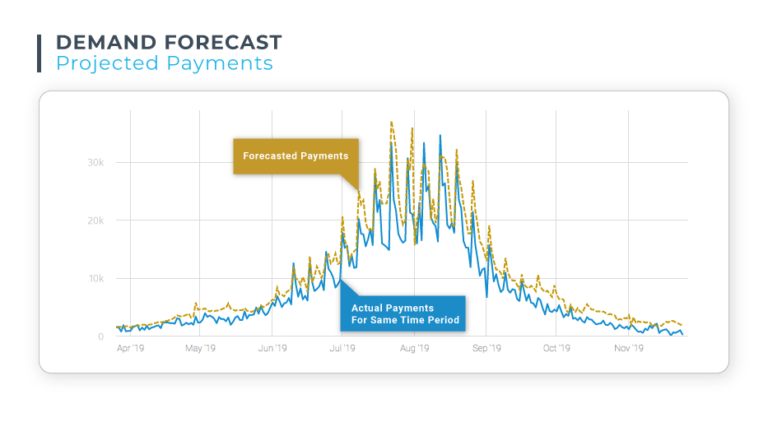
Forecasting Currency Needs
The nature of Payoneer's business is that customers can withdraw funds from their own accounts at any time. Payoneer must have sufficient funds available, in the currency the customers prefer, to meet withdrawal demands. The treasury team at Payoneer must make forecasts for account locations in more than 100 countries in 50 different currencies.
The team had been computing the forecasts manually, relying on their own experience and using excel spreadsheets. Payoneer now uses Anodot's forecasting solution to learn patterns in data pertaining to customer withdrawals. Anodot is able to predict which currency could experience a shortfall.
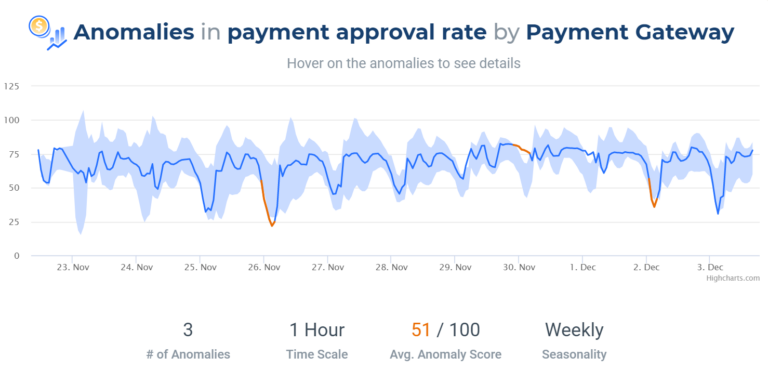
With Anodot, payment companies like Payoneer, fintechs, merchants and online sellers can benefit from autonomous payment monitoring. Our AI-based solution learns the behavior of each metric and adapts to seasonality. Anodot can identify payment anomalies even through fluctuating demand, proactively alerting payment teams, and automating resolution via KPI.
Monitoring for Cybersecurity Issues
Aviv Oren is EMEA Regional Manager of Production Services at Payoneer. He supports internal teams who need to know about anomalous conditions or activities. Oren calls it monitoring-as-a-service. "We are the ones getting alerts from Anodot on technical issues and we notify the appropriate groups about them," he says.
"Before Anodot, we tried detecting events using static thresholds. That resulted in a lot of false positives. We got alerts when there was really no issue but had to check to make sure things were okay. That wasted a lot of our time," says Oren.
Oren's team also monitors cybersecurity metrics to help detect malicious activity against the company's numerous applications and systems. For example, the production services team gets an alert when there's an unusually large number of successful logins, an increase in unsuccessful logins, or even a drop in successful logins. Anomalies in these metrics could be indicative that an application's login page is being attacked or harvested.
Read more