By Maria Korolov
Published June 8, 2020 in TechTarget
Depending on your data needs, embedded analytics from a BI platform or a more custom-built analytics framework may work. Read on for the benefits of each option.
Mighty nice enterprise application you’ve got there, shame it doesn’t have any interactive visualizations and your users are going blind from staring at rows and rows of tiny numbers. Unfortunately, the easier something is to use, the harder it seems to be to develop, and budgets and resources are stretched tight — right now especially.
That’s where embedded analytics come in. Depending on how much customization you need and how fast you want it, there are two main options: embedded analytics from business intelligence vendors and embedded customizable analytics from development frameworks.
Embedded BI to the rescue
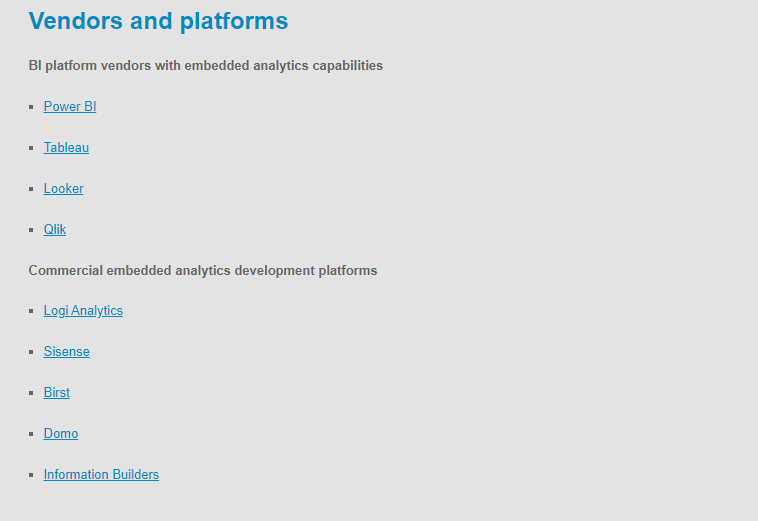
All the big business intelligence platforms, such as Tableau and Power BI — and smaller alternatives such as Qlik and Looker — have embedded analytics functionality. If your company is already using one of these platforms, the data connections are already in place, analytics have been set up and views have been created. All you need to do is add the embed code to your application.
Your end users will get pretty, interactive charts with a look and feel that they may already be familiar with right when they need to see them. And if you need to create new views or change existing ones, a business analyst or even a power user can do the work right in the BI platform — you don’t need any custom development.
Even technology companies benefit from being able to quickly embed visualizations from BI platforms. For example, DotData is a technology vendor working on automating the creation of AI and machine learning applications. If anyone could quickly whip up some embedded analytics, it’s them.
“We are visualizing our sales stats and financial data,” said Ryohei Fujimaki, CEO and founder of DotData. “But we are a small company and we don’t have the resources to spend on this.”
Instead, the company is using an existing BI platform with an embedded analytics option. Fujimaki declined to name the specific vendor they use but said embedded BI is the easiest option.
The downside is that there are limits to what a BI platform can offer.
In general, embedded BI analytics are passive views. Users can’t edit the data or add new data in the visualization. And you’re stuck with the BI platform’s display options. That means that you might — or might not — be able to match your enterprise application’s look and feel.
Additionally, according to Fujimaki, many of the platforms are still in the early stages when it comes to more advanced machine learning and AI capabilities or automation.
Development framework: More options, more work
What do you do if you want better control over the graphics, interactivity or data that is displayed? What do you do if you want users to be able to take actions right from the visualization such as update billable hours or re-sort and filter the data in a way that’s more relevant to them but isn’t a standard option with your BI platform’s embedded analytics?
That’s where the visualization development frameworks come in. There are commercial platforms and open source libraries that allow you to embed customizable analytics.
On the commercial side, Lewis Carr, senior director of product marketing and management at Actian, said that Logi Analytics and Sisense are good places to start.
“They are replacing hand-coded options based on a multitude of developer libraries and tools,” he said.
For customizable analytics, a commercial platform can get companies to market faster than a collection of open source libraries, especially companies that don’t have as much expertise in the subject.
“Furthermore, the use of ‘buy’ tools tends to reduce the buildup of costly technical debt over time,” Carr said.
But the libraries allow for an even greater level of control for customizable analytics and can provide cutting-edge capabilities that haven’t made their way into commercial platforms yet.
“For example, there are a lot of libraries that allow you to do machine learning and similar things,” said John O’Neil, chief data scientist at technology vendor Edgewise Networks. “The most famous ones are the deep learning libraries like PyTorch.”
It all depends on how out-of-the-box the problem is and how important it is to the business, he said. “If it’s key to the enterprise, you might want to build your own so you can do exactly what you want.”
He warned, though, that building from scratch requires not just the presentation layer but also getting the data into the right shape, doing the analytics and getting everything to work efficiently with a lot of data.
“That’s a nightmare of a job,” he said. “I’m glad I don’t do it.”
In some situations, however, there’s no alternative but to build from scratch.
“Governments traditionally have a build-your-own type of philosophy,” said Kathleen Featheringham, director of AI strategy and training at Booz Allen Hamilton. “That can be costly and hard to integrate. It’s a redo every single time something changes. To keep those maintained, that’s really hard.”
In addition, there’s no one big development framework that is the platform of choice for creating embedded customizable analytics. Instead, she said, there are a lot of smaller tools for specific problems and use cases, such as libraries for geospatial visualizations. Open source tools in the Python ecosystem include Bokeh, Matplotlib and SeaBorn. Popular JavaScript tools include D3, React-vis, Chart.js and VX.
“D3 is a JavaScript framework that is good at making fast but rich analytics presentations,” said Ken Seier, national practice lead and chief architect of data and AI at Insight, a technology consulting and system integration firm.
Unlike the embedded analytics available from the BI platforms, however, these frameworks may be missing key functionality, such as the data pipelines or AI or machine learning capabilities.
“You would need additional code or engineering to provide the other components,” he said. “But the advantage is that you can do a lot with it.”
Most of the time, Seier said, the embedded analytics available from the BI platforms are good enough.
“For most of our users, we take something from a BI platform and put it in an application and it meets user needs,” he said. “But if it has to be highly published or exceeds the capability of the BI tools, we do custom development. And a BI tool is focused on consumption only. If you want to make interactive decisions, that’s done more through the transactional application mode.”
In addition, if the embedded customizable analytics visualization pulls data directly from the transactional database, it can be more up to date than one that comes through the BI platform.
Roadblocks with embedded customizable analytics
One thing to be careful about, however, is that custom-built embedded analytics can be fragile and can break if something changes. And getting them to work perfectly can be a challenge.
“I personally believe that using a powerful visualization tool that is simple to use and maintain is key to the success of the embedding project,” said Hadar Fogel, head of global engagement at Anodot, a business monitoring company. “If your embedded dashboards crash, take ages to load or are not intuitive, people will just not use it.”
It’s a shame, she said, when a company invests a lot of time and resources in a project and then gets zero value out of it.
“Some customers I worked with initially thought their data is so unique that no off-the-shelf visualization tool can support it,” she said. “In most cases we discovered together that this concept is wrong. There are very strong and flexible visualization tools out there.”


