Automatic remediation is today’s holy grail for IT teams. The promise of self-healing systems set the world’s leading technology companies in a race to be the first to develop one of their own.
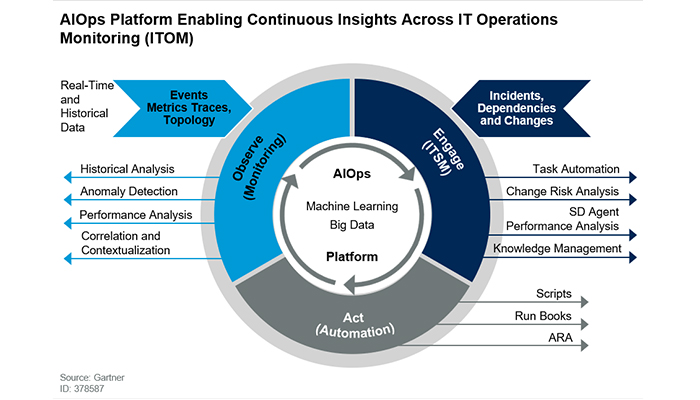
According to Gartner, an AIOps system performs three processes:
- Observe
- Engage
- Act
Each stage involves multiple components. This article will review those needed for the first state, monitoring, such as: anomaly detection, correlation, task automation, knowledge management and scripts.

At the heart of AIOps is an effective observation system that surfaces and contextualizes anomalies to guide root cause analysis.
What Is Root Cause Analysis?
More companies today offer a root cause analysis engine to support their alerting system. When the system’s algorithms alert you to an issue it also presents any related anomalies and events, which saves teams the time it would normally take to dig through dashboards to find commonalities. By helping point to the underlying issue, this feature can direct you to take action sooner or, in the cause of AIOps, trigger remediation.
Root cause analysis involves several processes and capabilities:
1. Learn the norm
-
-
- Establish the baseline: Learn how metrics normally behave, for example, how they typically fluctuate during weekdays, weekends, mornings, evenings, etc.
- Adapt to change: Identify when those patterns change and adapt to the new norm. Business metrics are largely influenced by human behavior, which is why they’re far more dynamic and volatile than hardware or application metrics. You’ll need a system that can learn data patterns and seasonality and adjust the baseline as needed.
-
2. Detect what is not normal
Identify anomalies from the normal pattern as quickly as possible. Anomaly detection should run on streaming data to enable real-time alerts.
3. Understand the anomaly’s significance
While most anomalies are not interesting, some are very important. In order to understand why, you’ll need a deeper context. Start by reviewing:
-
-
- Business Impact: An anomaly which is directly related to revenues may be more critical than an anomaly related to engagement.
- Anomaly Frequency: Some metrics are more stable than others – an anomaly on a stable metric might be more interesting than one on a dynamic metric.
- Size: Big anomalies are probably more interesting than smaller ones. But before delving further, review the data being analyzed. For example, if an ad campaign sees a jump from 20 impressions to 30, that certainly is anomalous, but is this campaign sizable enough for you to care?
-
4. Identify the leading dimensions
When several KPIs are acting irregularly, and they share several dimensions in common, how do you know which dimension is the relevant one?
For example, what if a series of correlated anomalies are affecting customers who all happen to live in the United States, accessed the site on their mobile device and were trying to pay with PayPal? Is it an issue with the payment API? Servers in that location? A bug for mobile devices? Identifying the leading dimension is crucial for effective root cause guidance.
5. Correlate with metrics and anomalies in the data ecosystem
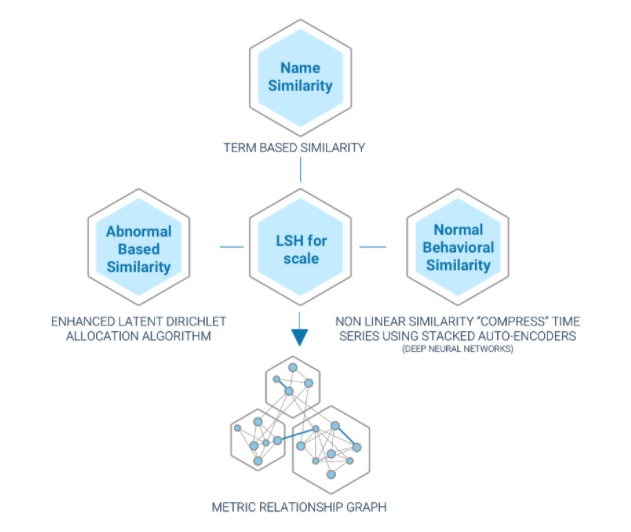
Oftentimes one metric is affected by another. For example, a spike in errors might also result in drop in user engagements. Understanding the relationship in the metric ecosystem is critical to establishing the root cause.
6. Understanding the relationship between KPIs and events
Some metrics are affected by events such as version releases, promotional campaigns, holidays and even weather. Intelligent systems learn how previous events have affected the metrics and forecast expected behavior. Also, even pointing out that an event has happened and its relation to the metric can have a positive impact on time to remediation.
What are the next steps?
Root cause analysis is a crucial – and very complicated – first step, but the path to automatic remediation is still long. How do you choose the correct remediation action? How do you monitor the action taken?
Speak with an expert at Anodot, which Gartner listed as a leading AIOps vendor, to learn more about the challenges of automated remediation and how anomaly detection can help.


