Business analytics is the iterative process of exploring the available data at an organization, typically using statistical analysis and dashboard reporting.
IT monitoring, on the other hand, is a broad field that’s designed to monitor IT equipment and ensure that it’s performing at expected service levels.
In the past few years, however, many companies are starting to realize that these two, once separate methodologies, have merged into a new discipline: business monitoring.
Business monitoring merges these two fields in that it’s used for monitoring business metrics in a way resembling how IT metrics have traditionally been monitored. A key difference, however, is that due to the complex and volatile nature of human-generated compared to machine-generated data, business monitoring makes use of AI and machine learning to solve these challenges.
In this guide, we’ll review how business monitoring works, why it has become the new standard in business, and how you can make use of it to stay ahead of the competition.
The Business Analytics & IT Monitoring Landscape
Before we get into the specifics of business monitoring, let’s first review how business analytics and IT monitoring have traditionally worked in an organization.
Business Analytics
The new reality for nearly every business is that they generate massive amounts of data that may hold the key to their future success, and thus needs to be constantly analyzed. Many companies today still try to feed this data into legacy BI tools, although it’s become clear to many that these platforms require complex coordination and maintenance to deal with things like structured and unstructured data, cataloging data sources, adjusting static thresholds, and constantly building and “eyeballing” dashboards. To solve the challenges of modern business analytics, the field of autonomous, AI-based analytics has emerged as the dominant way to deal with the volume and volatility of human-generated data.
IT Monitoring
As discussed in our white paper on Business Monitoring, many companies have tried to feed business metrics — such as revenue, user activity, and customer experience — into APM or IT monitoring systems. These solutions can monitor metrics in real time based on log or application data. The issue, however, is that these systems are built to monitor machines and not the human behavior that shapes business metrics. APM and IT monitoring solutions fail to understand the nuances and seasonality present in business data, and consequently are unable to produce the accuracy and granularity that’s required to reduce both time to detection, root-cause analysis, and time to resolution for the incidents that most impact the bottom line.
The reason for this shortcoming is quite simple:
Monitoring machines and monitoring business KPIs are completely different tasks.
Why Business Monitoring Has Become the New Standard
There are three main reasons that business metrics and KPIs are completely different from monitoring machine-generated data: context, topology and volatility.
- Context: One of main differences of machine-data versus human-generated data is that context plays a large role in the latter. In particular, business metrics can’t be evaluated on an absolute basis, but rather in the context of changing conditions. The most common example of this is the ever-changing seasonality of human behavior, which must be accounted for in a business monitoring solution.
- Topology: When we’re monitoring machine data we already know the relationships, or topology, between different machines and metrics. With human-generated business metrics, on the other hand, the topology is unknown. This means that we need autonomous algorithms to learn and map these unique relationships on their own.
- Volatility: Unlike machine data, business KPIs are irregular and volatile. Instead of frequently getting new data at each time step, there may be several minutes or hours without certain user activity, such as a purchase for example. This irregular sampling rate means that we need a monitoring system that can adapt to these changes in real-time.
As a result of these three unique challenges, business metrics require a new monitoring methodology that’s based on AI and machine learning.
How AI & Machine Learning Deal with Complexity
AI and machine learning can deal with the above-mentioned complexity in the following ways:
- Granularity: AI & machine learning can monitor 100% of the data in real-time. This is contrasted to a BI solution that might simply summarize data into a KPI, but not actually monitor the individual data points.
- Fully Autonomous: Through the use of unsupervised learning, the system can learn each one of the data points’ usual behavior on its own.
- Correlation & Root Cause Analysis: Each metric can also be correlated to one another, and with a root cause analysis you can go from detection to resolution in the fastest time possible.
In addition, an AI-based approach to analytics and monitoring is fundamentally different in that it’s proactive instead of reactive. Traditionally, analytics and IT teams were asked to analyze trending issues in the organization and create new dashboards to explain them. In the age of AI, we’ve now shifted to a world where analytics and monitoring can autonomously scan 100% of an organization’s data in real-time, resulting in a proactive edge over the competition.
Another class of AI analytics, augmented analytics, is growing in adoption as companies look for ways to automate data insights and expand a human’t ability to interact with data at a contextual level. Augmented analytics uses AI and machine learning to brining analytical capabilities to more people.
Use Cases: Applications of Business Monitoring
Now that we’ve discussed how business monitoring has merged two fields to become the new norm for analytics and IT monitoring, let’s review several real-world use cases so you take advantage of it in your own organization.
Revenue Monitoring
As discussed in our article on the Single Most Important KPI in Business Monitoring, many companies today monitor metrics such as application performance, user activity, and conversion rates. While user experience metrics like these are undoubtedly important, they often fail to identify revenue-critical issues. Instead, monitoring payment transactions and revenue streams should be the cornerstone of a modern monitoring strategy.
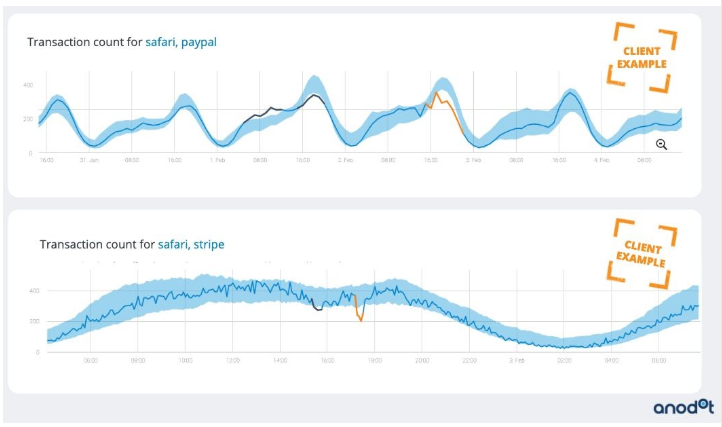
To give you a real-world example of revenue monitoring, one of Anodot’s clients was able to use autonomous monitoring to identify and correlate a faulty version release with a drop in PayPal and Stripe transactions. It turned out that by using AI and machine learning for transaction monitoring, the company was able to fix the issue within minutes and prevent significant revenue loss.
Partner Monitoring
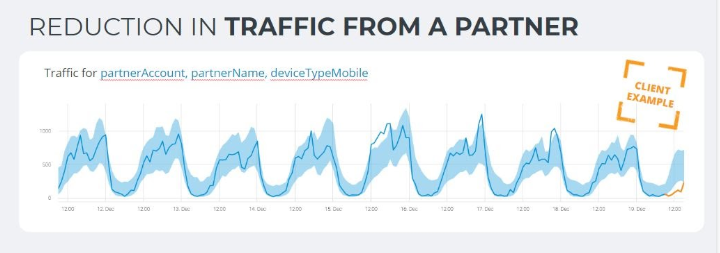
Another example of business monitoring is using machine learning anomaly detection to scale partner and affiliate tracking. As you probably know, operating in today’s business landscape often requires working with an extensive network of partners and third-party providers. While these partnerships offer new avenues for growth, they inevitably create additional layers of complexity that must be monitored. Since these partner-generated business metrics are heavily influenced by human behavior, things like setting static thresholds simply can’t deal with the often seasonal nature of data.
If you want to learn more about partner monitoring, check out our case study where a real-time alert for drops in referrals helped the team identify at-risk accounts. This fast time to detection allowed the company to proactively provide the at-risk accounts with the support they needed, and build even stronger relationships with their partners.
Customer Experience Monitoring
A final example of business monitoring is customer experience monitoring, which tracks user-related metrics such as the churn and retention rate. As discussed in our Guide to CX Monitoring, user-generated data is often made up of thousands of different metrics, all of which have their own dynamic, volatile, and seasonal behavior. Unlike traditional BI tools, AI and machine learning can learn each individual metrics’ normal behavior on its own and adapt to changes in real-time.
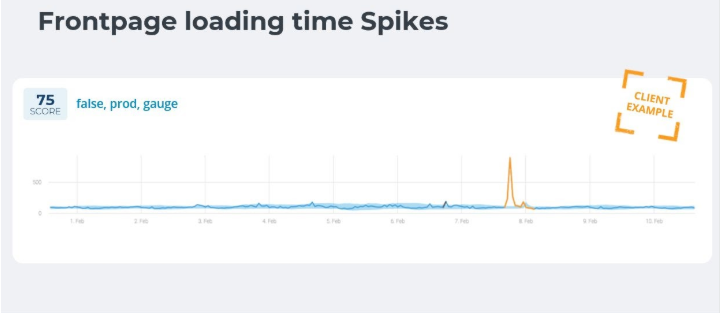
One example of improving the customer experience (that we’ve all experienced at one time or another) is monitoring the page-load times of a website. One of Anodot’s customers, an eCommerce company, experienced a glitch in their front page load time due to a new website version deployment. As you can imagine, this caused a sharp drop in add-to-cart and purchases during the downtime. Luckily, the monitoring solution was able to catch the anomaly and alert the team within 15 minutes before any significant revenue damage was done.
Summary: Business Monitoring is the New Standard
As the business landscape is constantly changing, it can be hard to differentiate which changes are truly impactful and which ones are just a fad.
One of the most significant shifts that we’ve seen in the last few years is the merging of two separate fields—IT monitoring and business analytics—into a single methodology: business monitoring.
Traditionally, companies have tried to feed business-related KPIs into IT or APM monitoring solutions, but as discussed, these solutions fail to deal with the complexity associated with human-generated data.
Business monitoring has emerged as a solution to the challenges that all modern, data-driven organizations face. One of the main advantages of business monitoring is that it can be fed any type of data, regardless if it is machine-generated or if it is a highly seasonal business-related metric.
Regardless of the type of data, with the help of AI and machine learning, business monitoring learns the unique behavior of each one of these metrics on its own in order to detect and resolve anomalies in the shortest time possible.


