The global pandemic has changed B2C markets in many ways. In the U.S. market alone in 2020, consumers spent more than $860 billion with online retailers, driving up sales by 44% over the previous year.eCommerce sales are likely to remain high long after the pandemic subsides, as people have grown accustomed to the convenience of ordering online and having their goods – even groceries – delivered to their door.
Despite the growth in online sales, eCommerce companies continue to deal with the perennial problem of shopping cart abandonment, online consumers who quit the checkout process before completing a purchase. According to Dynamic Yield, the average shopping cart abandonment rate globally is 70.05%.
Why Shoppers Abandon Carts
There are numerous reasons why shoppers might forgo their prospective purchases. Perhaps they were only comparison shopping among products or different e-commerce sites. It could be that the checkout process is too cumbersome, or the store doesn’t accept the forms of payment shoppers prefer.
But sometimes system errors or technical issues lead people to leave the purchase funnel or abandon their carts. Perhaps the payment platform isn’t working right, or the product page isn’t loading, or a new customer can’t complete the account creation process. In cases like these, shoppers tend to abandon their cart and leave the merchant’s site in frustration and disappointment—and the merchant may never know why it is losing sales.
Why Traditional Monitoring Falls Short
Online shopping issues are almost impossible for eCommerce companies to detect manually. There are just too many metrics and dimensions – different products, devices, campaigns, sessions, etc. – to manually detect issues that impact customer experience and revenue.
Another challenge with traditional dashboards is the time it takes to realize there’s a problem in the path to purchase. Delays between anomaly occurrence and detection can take hours, sometimes days. That’s a delay eCommerce business can’t afford if they want to remain competitive and reduce customer churn.
How to Catch Online Shopping Incidents Quickly
The best way to detect incidents in the purchase funnel is to put all business level KPIs and data points into a machine learning system that can learn normal patterns and automatically detect anomalies.
For system metrics, it’s important to learn shopping behaviors across every dimension in a very intimate way. For example, the ML platform would need to learn how many times shoppers search for a product, how often it is added to a cart, what the average cart size is, whether the product was on a special promotion, what time of day or day of week the product sells best, etc.
There might even be “seasonality” to these metrics, such as the pattern of sales over a week, a month, a year, during special promotions that are seasonal (think “back to school” shopping), and so on.
After learning the normal patterns of the various metrics and dimensions, the anomaly detection system can analyze incoming data feeds of all the metrics and quickly identify anomalies in real time. An alert notifies data analysts that something is amiss and needs attention.
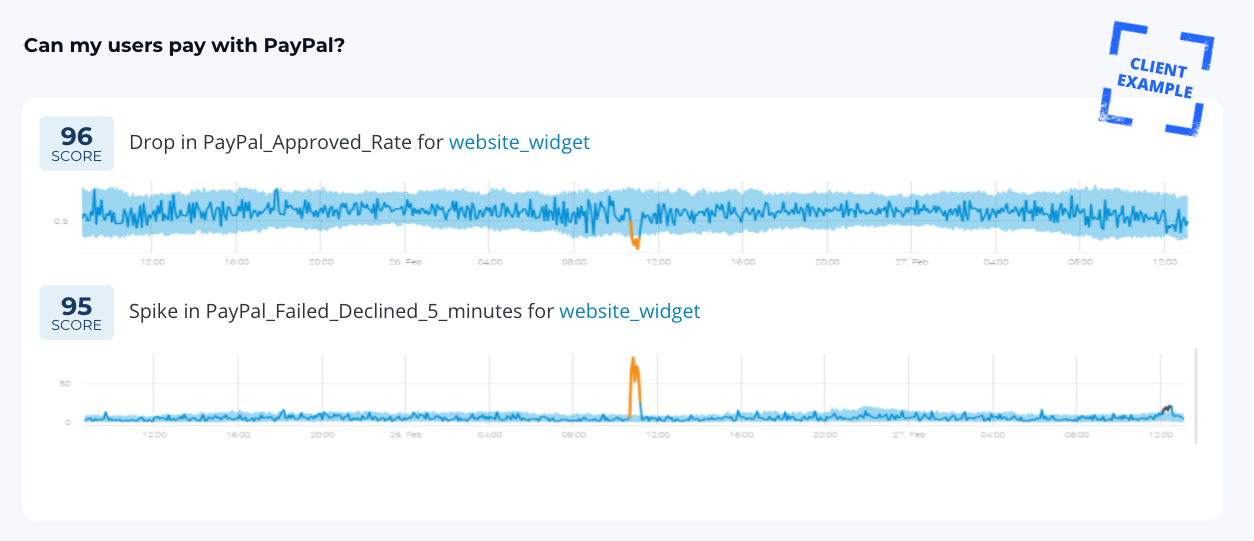
In the example below, the alert reveals a significant drop (the solid orange line) in the approval rate of payments using the PayPal widget as compared to the typical approval rate (shaded blue area). The drop is correlated to the time when a spike in downtime of the PayPal widget is occurring, indicating a problem with the payment platform. To prevent a loss of sales when such a glitch is happening, the merchant can advise customers to use another form of payment to complete their sale.
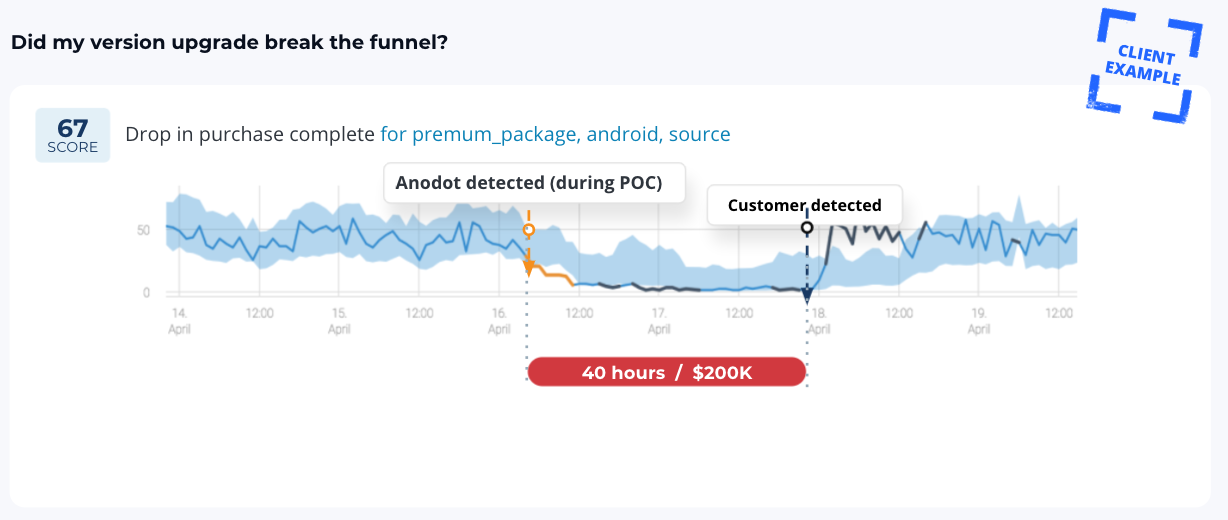
The next example shows a lengthy drop in purchase completions for a particular product when the shopper is on an Android device. The cause of the problem was a software upgrade for the Android app. Once the anomaly was detected due to a low volume on the purchase metric, the developer was able to correct the app and prevent extended losses in sales.
How Correlation Helps with Investigations
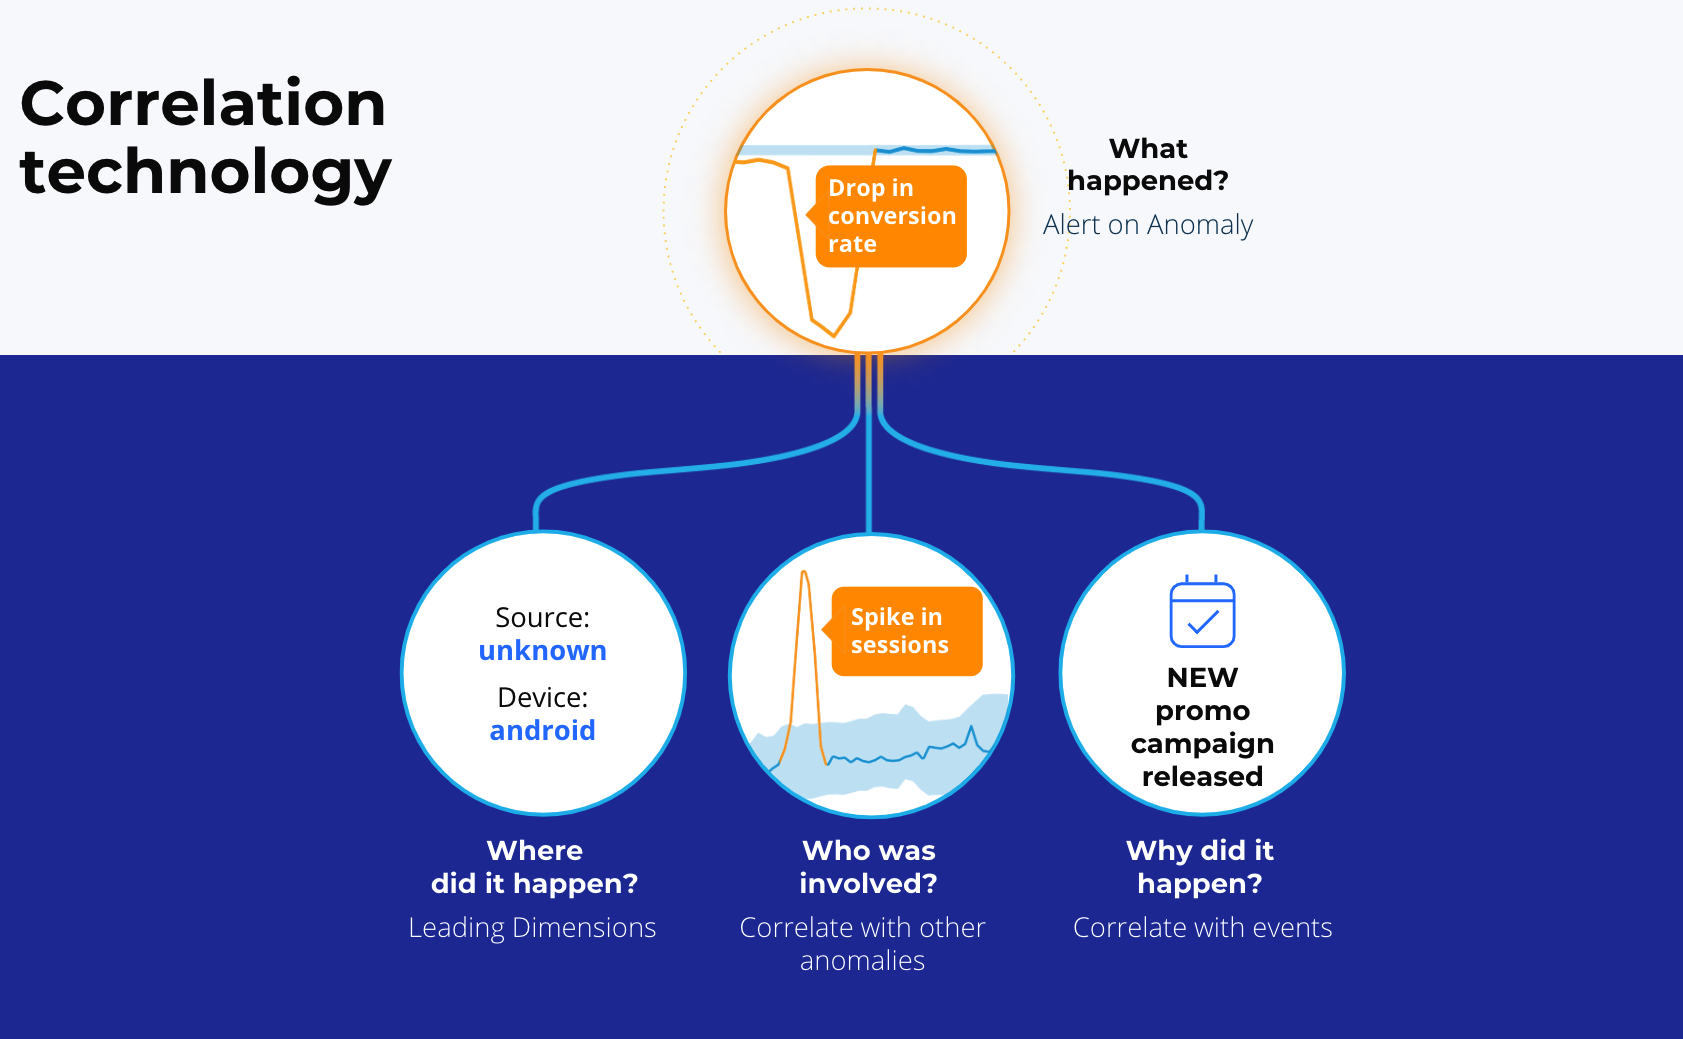
But why is an anomaly happening? Where to begin to investigate? Correlation analysis helps with these questions. By having related anomalies and events grouped into one alert, you can get to the root cause of conversion issues faster. In the graphic below, the top circle is an anomaly that has been detected.
The right circle shows the related events (ex: holidays or promotions) and anomalies that are happening concurrently and grouped in that alert. The left circle identifies the leading dimensions within the monitored metrics. This is real-time insight that helps merchants find and fix the root cause of problems before they impact the bottom line.
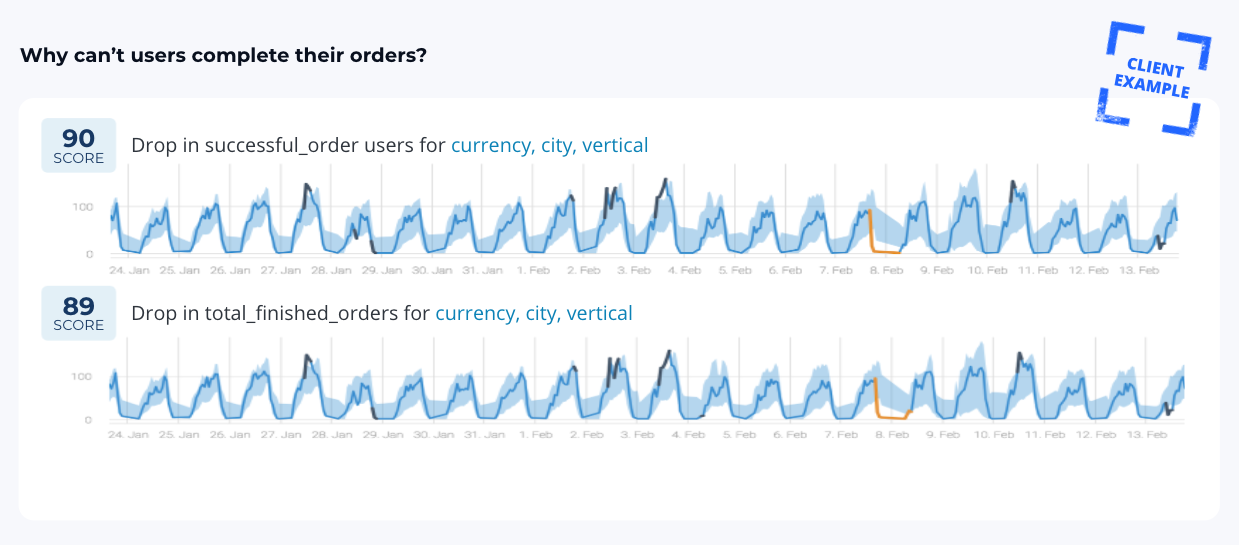
The image below is a good example of how correlated anomalies can point to the source of a system problem. In this example, a drop in successful orders corresponds to a drop in finished orders, which seems to indicate a problem with the process to finish orders. That would be the first place to investigate if there is anything wrong with the underlying process.
eCommerce businesses can’t afford to wait until the end of the sales day, or week, or quarter to understand if there is a problem in their system that is resulting in cart abandonment. An anomaly detection solution with real time alerts can let you know if problems or errors are occurring that should be investigated promptly to prevent shoppers from leaving items in their carts before the sale can be completed.


