Anodot recently took part in the 2021 Data Agility Day, an event dedicated to examining how organizations are extracting value from data. Anodot CEO and Co-Founder David Drai was joined by David Ashirov, VP of Data at Freshly, where he has worked to build a data stack that departments across the company could leverage to drive business.
Ashirov is a senior executive with two decades of experience in data engineering, business intelligence, and marketing. He has developed data-driven products and strategies that allow for fast growth and greater efficiency, and can even create new revenue streams.
For the past three years, Ashirov has led the data team at Freshly, a prepared meal delivery service acquired by Nestle in 2020, where the estimated revenue per employee is $140,408. This is a phenomenal feat, considering the average small business brings in an average of $100,000 in revenue per employee.
According to Ashirov, Freshly’s data infrastructure and Anodot’s observability are driving factors behind the company’s profitability.
Step 1: Build a Data Platform
When Ashirov joined Freshly a little more than three years ago, the company didn’t yet many systems in place to measure and evaluate data. People relied on intuition to know whether the business was doing well. This worked pretty well for a startup company, but as many data leaders know all too well, human intuition doesn’t scale.
Ashirov’s first mission was to build a data fabric, a system where technology connects data across the company. He needed to get the company to a place where they could query every bit of data without having to jump through hoops.
“We wanted a single place to get information around any business question,” Ashirov said. His goal was to get people inside the company to trust the data to tell them anything they want to know about what’s happening with the business.
His data team started with bits and pieces of existing technologies that weren’t really used to create a data fabric. They spent months evaluating what they had and what they needed in order to build a standardized platform for data collection, warehousing, analysis, and alerting.
“It took a few months to set up ingestion to make sure that all the data sources out there were collected and moved into a single query space,” Ashirov said. “We selected a different data warehouse provider, a software as a service. Processing was organized but items were hidden from view so we didn’t pollute the analytics space with transient data. We looked at the output, in our case a BI solution, to make a single semantic layer that every business concept is expressed in. It also has a data dictionary with the business glossary on the side where people can come in and find anything related to the business and pull it out at their will ¬– this constitutes what I call the data fabric. I would say it is genius in its simplicity.”
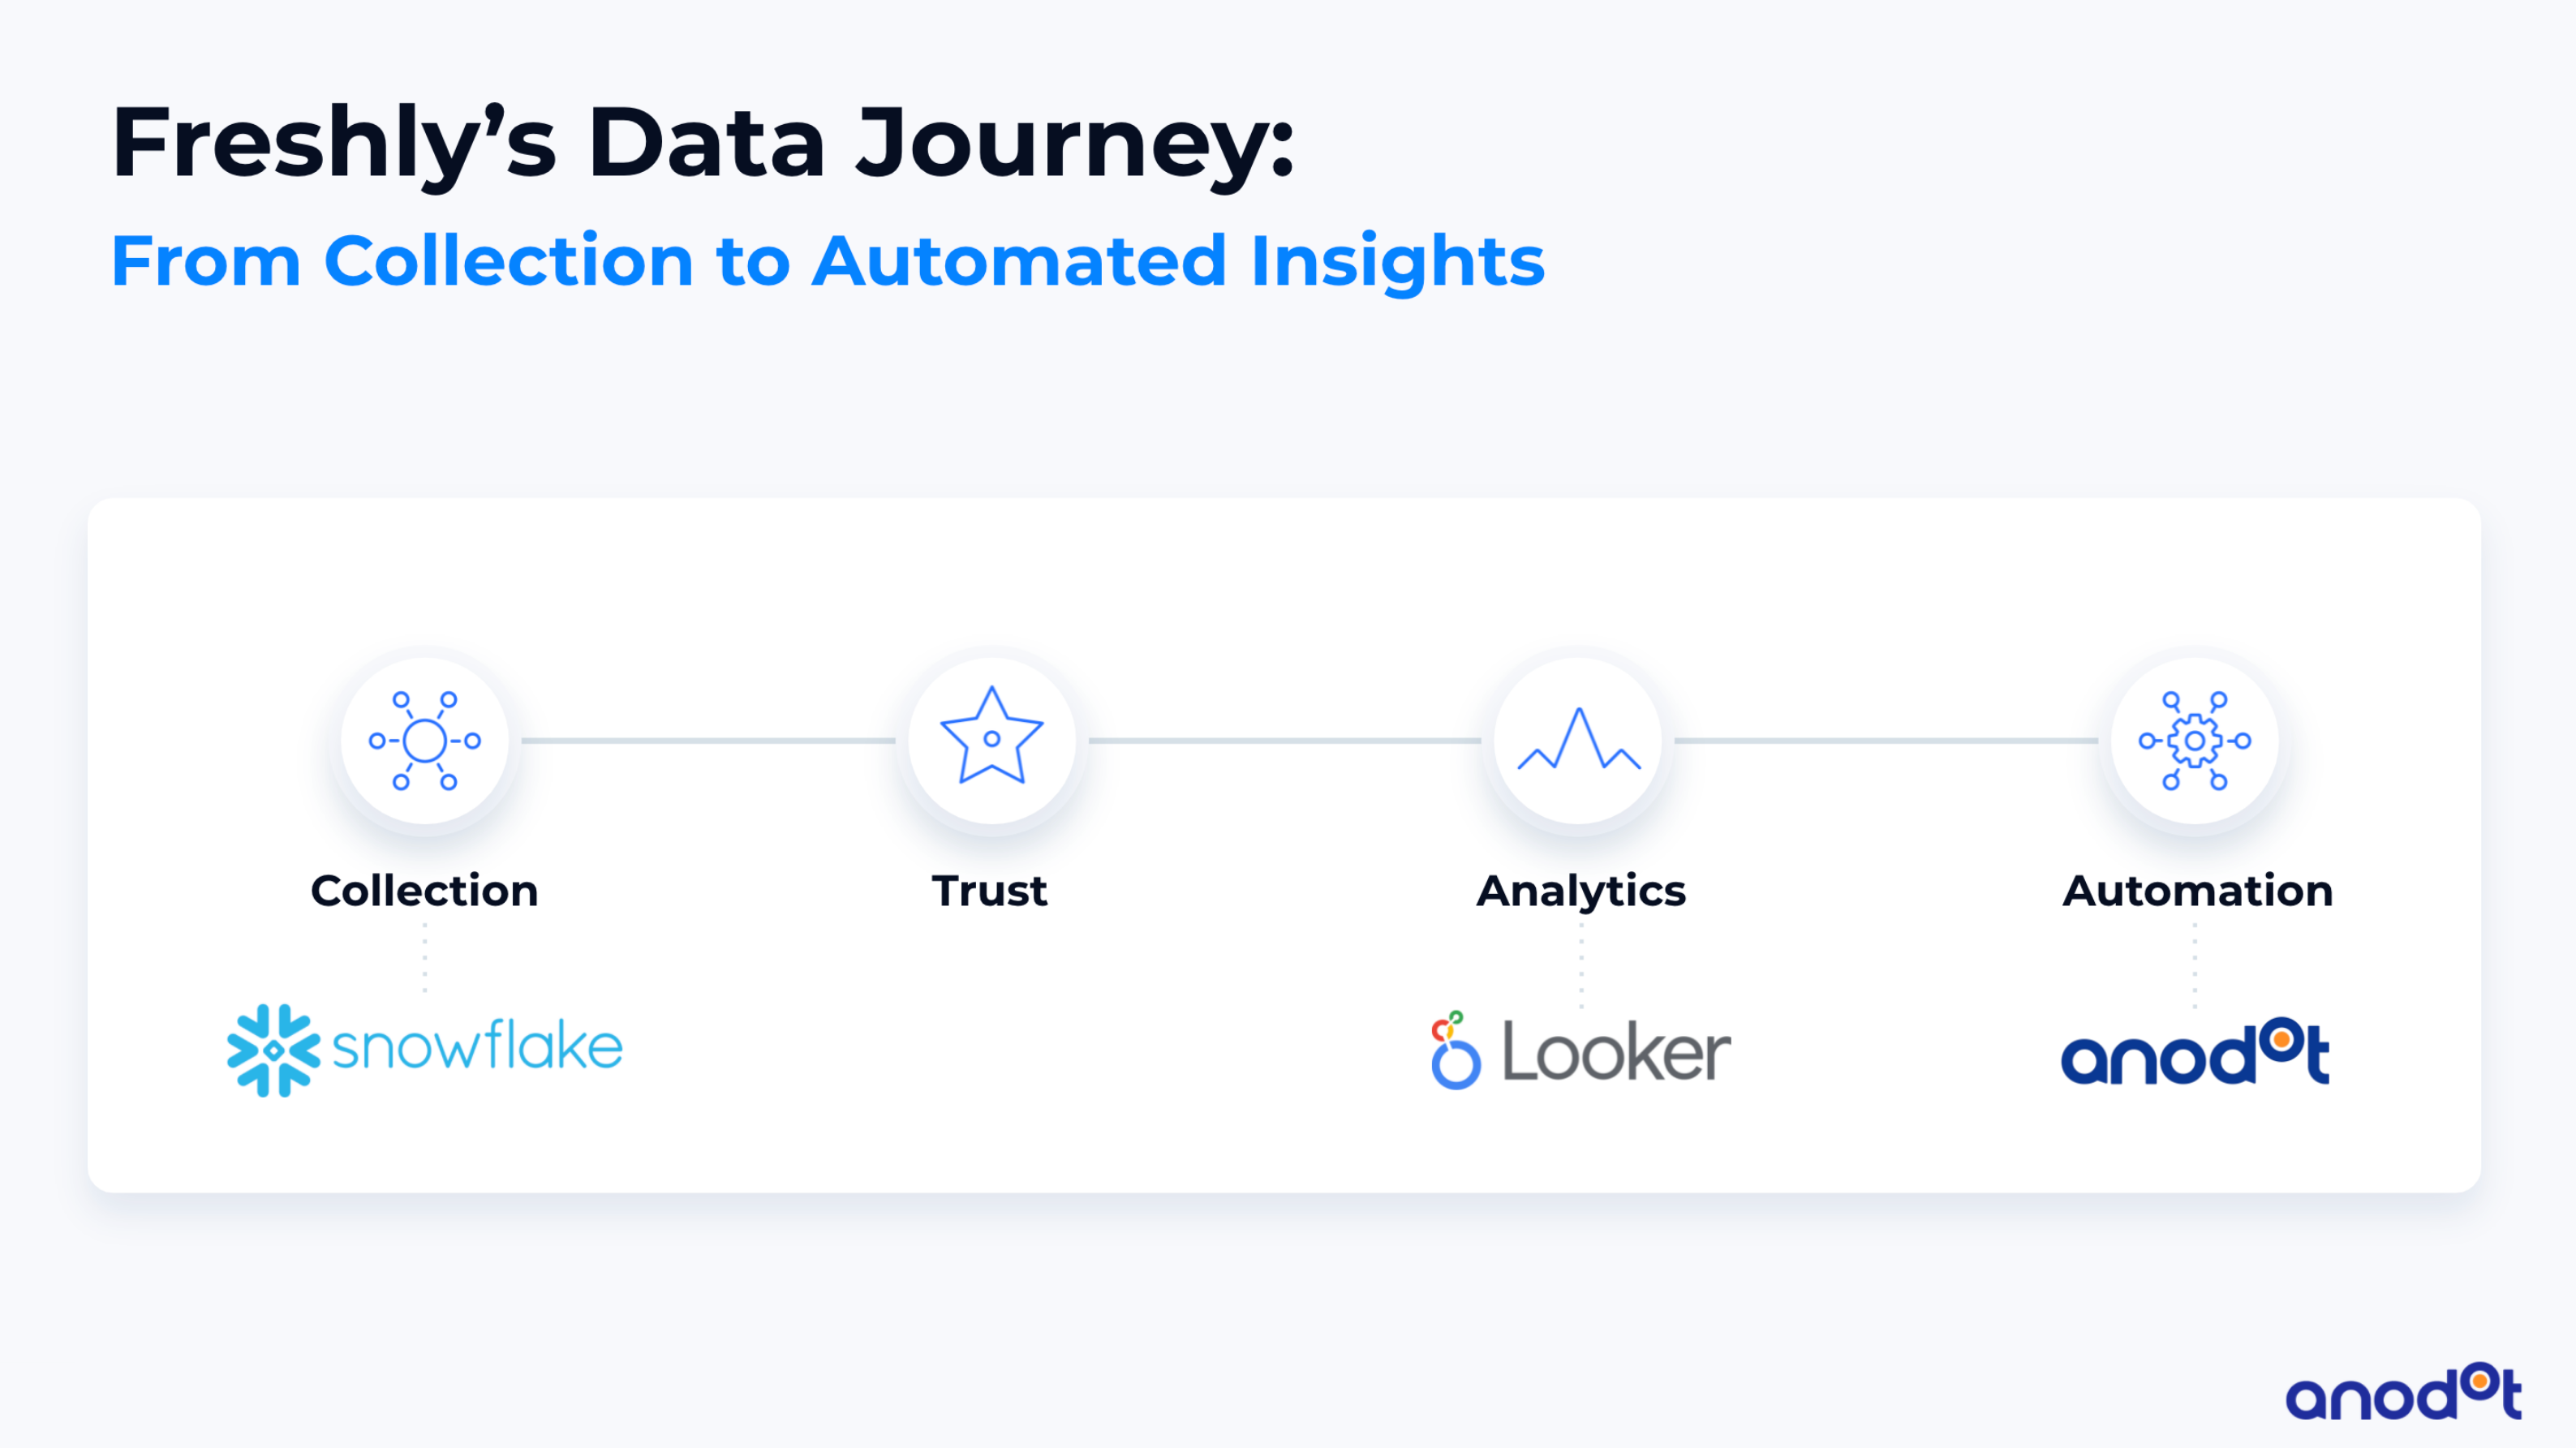
The SaaS products they used to build this platform consist of xxx for data capture; Snowflake for data warehousing; Looker for the BI platform; and Google Cloud for various needs, such as orchestration of lambdas and containers, APIs, web UIs, and so forth. Anodot Autonomous Business Monitoring is the final piece that allows for continuous data monitoring in real time.
Step 2: Gain Trust in the Data
With the data fabric in place, the team then spent about a month building every kind of report that anybody in the company could want.
“Then we could have descriptive analytics deployed to everyone, regardless of their position in the organization. Everybody gets what they need. That’s a lot of work to pack into a month but it’s essential,” said Ashirov. “At this point we acquired trust in the data, in the data department, and in the data platform. We saw that people were changing their behavior. They asked us for assistance and didn’t try to figure things out for themselves. We entered a collaborative mode where we could scale our own operations. Now we have a huge amount of data that is trusted. The next step was to figure out how we can get insight from this data.”
Step 3: Get to Know the Business Processes
To do that, the data team interviewed internal stakeholders about their business processes and data needs. “You need to understand your entire business model from beginning to end—the entire cycle,” Ashirov said. “You have to map the business processes and understand at which points in the processes to establish a sensor to collect information. Those sensors are your business metrics that you measure in the middle of the process. This is what tells you if the business is doing well or experiencing an issue.”
It could be something that can move the needle if some sort of adjustment is made. It is where you can change the process to improve something. “It’s a little bit of investigative work because you have to speak to a lot of stakeholders, people in different departments, and understand how they go about their business,” said Ashirov. “You have to create this formal document that describes how they go about their business and what they anticipate to be changing in the near future, where the changes will come. Once you have that, you devise metrics that you can measure.”
Step 4: Monitor the Metrics for Abrupt Changes
By looking at everything in multiple dimensions, you can end up with an exponential number of metrics that are too hard for a person to observe and tell if they are good or bad, or if variations are happening. This is when it’s necessary to deploy a tool like Anodot to monitor every metric for changes that are abrupt and material to the business, i.e., anomalies.
With millions of metrics to be monitored, Ashirov said it’s critical for them to group similar things together that are affected by seemingly similar events. “Then you can examine them collectively and not individually. You need some sort of an impact analysis to understand how material the impact is and create an impact analysis to all of the individual things in the back to sort of bubble up to the top, because those are good candidates for root cause analysis,” he said. Anodot calls this correlation of metrics.
“At some point you need to perform a root cause detection or group those anomalies together to rationalize what’s causing a problem. If there are multiple simultaneous happenings, you need to prioritize. You first carve them out into separate groups and then prioritize which ones you are going to address. This might be determined by impact, by frequency, by volatility, by return on investment. If you have five of them, you’ll probably want to deal with the biggest one first, or the most annoying one that constantly reoccurs.”
The Importance of Data Observability
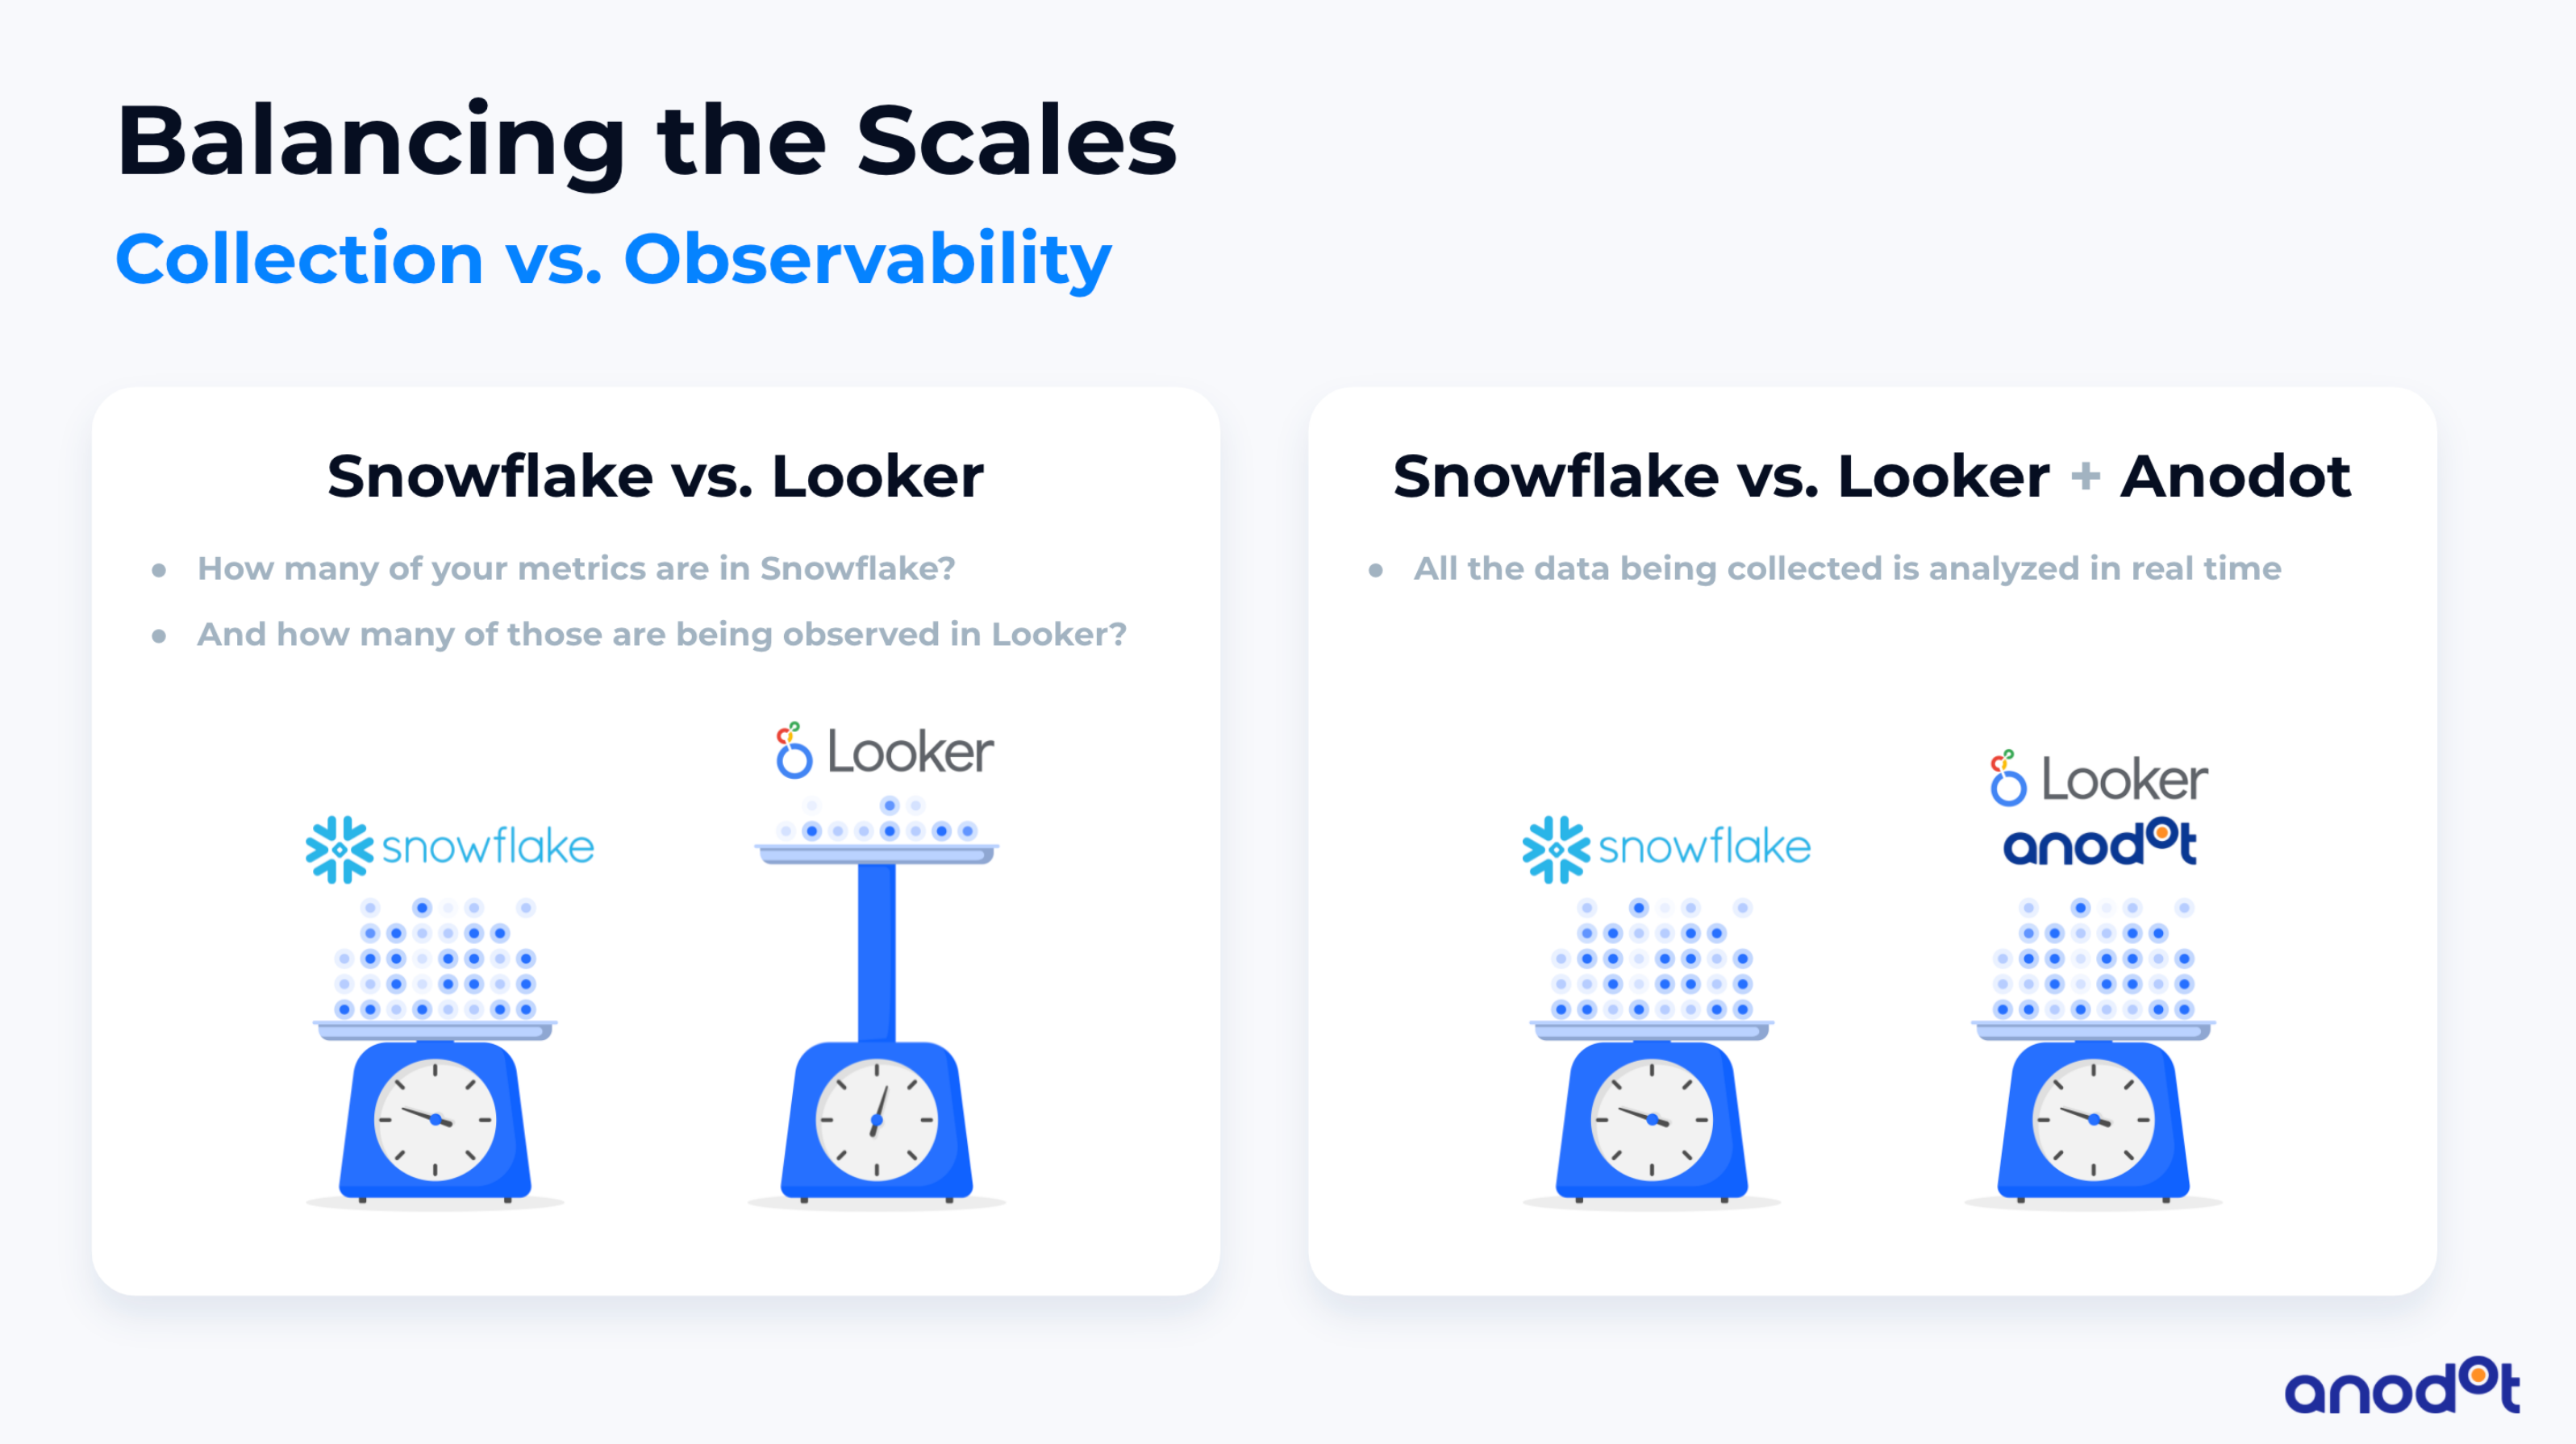
Ashirov understands the value of balancing robust data infrastructure with automated data monitoring. When mass data is monitored comprehensively and in real time, companies can easily fall victim to the kind of incidents that can drain millions in revenue.
Prior to Freshly, Ashirov worked for a global company that relied on Google services to monetize their assets. Quite suddenly, every single metric where Pakistan was a contributing factor fell off a cliff. In metrics where Pakistan was the only dimension, numbers went straight to zero.
With Pakistan driving much of the company’s business, this company received five million alerts listing the country as a dimension. Within that noise, no one was able to find the one metric that revealed the root cause. It turned out that Pakistan had blocked local access to Google services for political reasons.
Once they discovered the issue, fixing the problem was very easy. All they needed was a software update to replace the URL that was down with another one. It took about two hours. Meanwhile, the outage lasted several days and cost the company significant revenue.
Ashirov said there was a lesson in this experience.
“To find the needle in the haystack and to understand that something in the greater world happened that you weren’t monitoring … nobody anticipates a political event affecting your numbers,” he said. “There is always something there that you didn’t account for and you need to know at the speed of business, not at the speed of ‘we will get to it at some point’, and not when somebody else tells you that something has happened. You need to act soon. You need to have systems in place to help you do that.”
Freshly uses Anodot Autonomous Business Monitoring to monitor in real time for anomalies that can have a material impact on the business. The alerts are prioritized and include guidance on the root cause. Using Anodot, Freshly can respond to incidents quickly to ensure that the impact to the business is minimized and significant revenue is not lost.


