Everyone from managers to C-suite executives wants information from analytics in order to make better decisions. Business analytics gives leaders the tools to transform a wealth of customer, operational, and product data into valuable insights that lead to agile decision-making and financial success.
Traditional business intelligence and KPI dashboards have been popular solutions but they have their limitations. Creating dashboards and management reports is labor-intensive, plus someone has to know what to look for in order to present the information in graphical or report format.
The Limitations of Traditional Dashboards
The information that is surfaced tends to be high-level summary data which only pertains to some of the company’s key metrics. This is largely because BI systems and KPI dashboards can’t scale to handle a significant number of metrics. As a result, managers are making decisions based on incomplete information.
In addition to lacking depth and breadth of data, these systems present historical rather than real-time data. While this is sufficient for observing trends over time – e.g., whether sales are increasing over time, what cloud costs are incurred monthly, etc. – using historical data takes away the ability to make decisions and act on something that is happening right now. Moreover, the high-level reports and dashboards aren’t helpful when needing to find the source of an issue because of the lack of context and data relationships.
In short, business dashboards have their purpose for providing high-level summary information but they fall far short of being able to present in-depth, real-time information to support decisions and actions that must be taken now.
Beyond Dashboards: AI-Powered Analytics Scale Up to Go In-Depth
AI-powered analytics is an enhancement over dashboards that enables the scalability to address all relevant business data. This allows a company to monitor everything and detect anything—especially events they didn’t know they had to look for — the unknown unknowns.
AI-powered analytics use autonomous machine learning to ingest and analyze vast numbers of metrics in real-time. Anodot’s Autonomous Business Monitoring platform is just such a system, and provides organizations with “a data analyst in the cloud.” Let’s explore the numerous benefits to using AI-powered analytics to closely monitor subtle changes in the business as they occur.
Work with Data in Real-Time to Accelerate Decision-Making and Action
AI-powered analytics is able to work with data in real-time, as it is coming into the system from multiple data sources across the business. Machine learning algorithms process the data and look for outliers in order to discover issues as they are happening rather than long after the fact.
It allows organizations to make timely corrections in their processes, if needed, to minimize the impact of negative anomalous activity. Of course, not all anomalies are problematic; some may indicate that something good is happening or spiking and it would be helpful to know sooner rather than later.
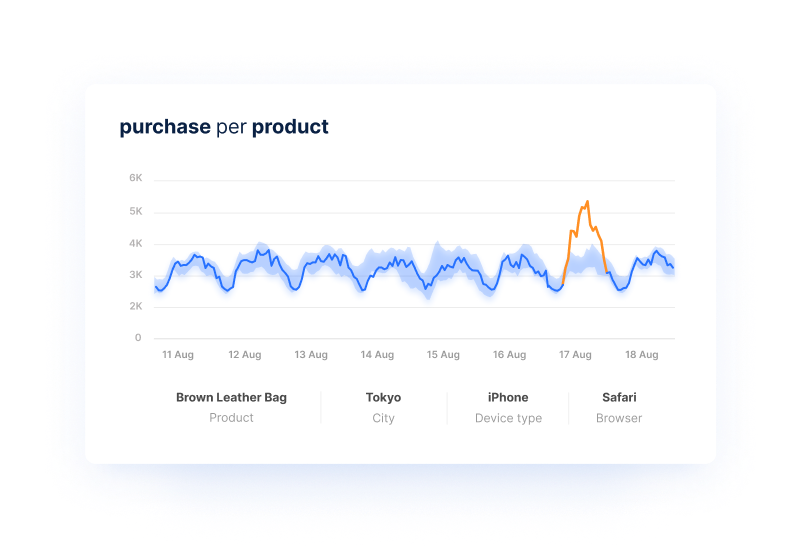
Take, for example, the case where a celebrity is endorsing a product on Instagram. The positive buzz generated by this external mention can really drive up sales of that product, but only if the business can respond in time to capitalize on the free attention.
A large apparel conglomerate learned this lesson the hard way when their BI team discovered a celebrity endorsement days after it occurred. If they had discovered the sharp uptick in sales for that product and the rapidly dwindling inventory of that product in one of their regional warehouses in real-time, they could have capitalized on the opportunity by increasing the price or replenishing the inventory to keep the customer demand fed.
The apparel company now works with Anodot to detect sudden spikes in sales of their various products. This information is detectable within minutes, and with immediate alerting to the spikes, the company can respond accordingly to ensure sufficient inventory to cover the unexpected (but very welcome) demand.
Work with Metrics on a Vast Scale
While a KPI dashboard might be able to track and present information on dozens of metrics, an AI-powered analytics solution can work with millions or even billions of metrics at once. More metrics means being able to get more granularity as well as more coverage – i.e., depth and breadth – into what is happening within the business.
The ad tech company Minute Media tracks more than 700,000 metrics in order to monitor the business from every angle. The company uses Anodot Autonomous Detection to detect anomalies in that data that could be indicative of invalid traffic, video player performance issues, or other conditions that lead to loss of revenue on ads. Since implementing the AI-powered analytics solution, Minute Media has been able to increase its margins on ad revenues to improve the company’s bottom line. (Read more about this success story here.)
Correlate Metrics from Multiple Sources
With thousands of metrics (or more) now in play, some of these metrics will have relationships with each other that may not be obvious on the surface. For example, a DNS server failure halfway around the world could be impacting a company’s web traffic that results in fewer visitors and lower revenue. The only way to identify this cause-and-effect relationship is through AI-powered analytics.
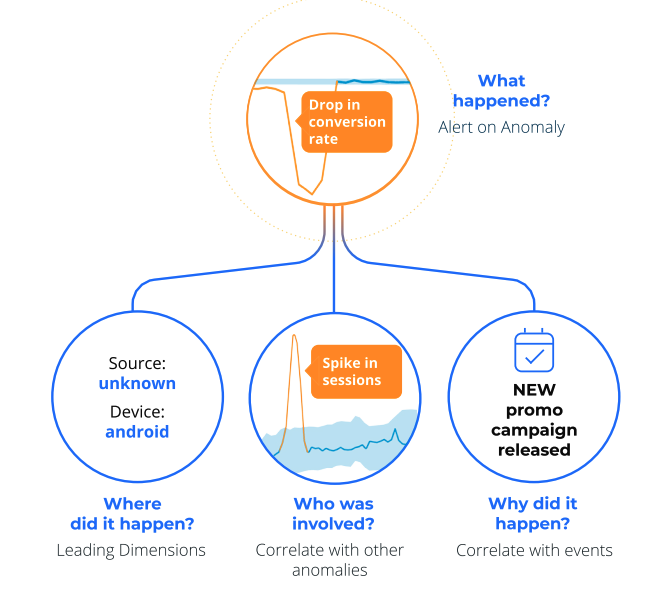
Solutions such as Anodot automatically correlate metrics from numerous sources across the business to uncover previously unknown relationships among metrics. Correlation analysis is incredibly valuable when used for root cause analysis and reducing time to detection (TTD) and time to remediation (TTR).
Two unusual events or anomalies happening at the same time/rate can help to pinpoint an underlying cause of a problem. The organization will incur a lower cost of experiencing a problem if it can be understood and fixed sooner rather than later.
Consider this example use case from the ad tech world. Both Microsoft and Google rely on advances in deep learning to increase their revenue from serving ads. AI-powered analytics allow these companies to identify trends and correlations in real-time, like instantly correlating a drop in a customer’s ad bidding activity to server latency. With the root cause quickly identified, the ad tech company can resolve the latency issue to help the bidding activity return to normal levels.
Let the Data Tell the Story Instead of Attempting to Predefine the Outcome
A clear benefit of using AI-powered analytics is that it can uncover insights in the data that weren’t expected or anticipated. No one has to predefine what they want the data to reveal. This is well illustrated with an example from another Anodot customer.
Media giant PMC was having difficulty discovering important incidents in their active, online business. The company had been relying on Google Analytics’ alert function to tell them about important issues. However, they had to know what they were looking for in order to set the alerts in Google Analytics. This was time-consuming and some things were missed, especially with millions of users across dozens of professional publications.
PMC engaged with Anodot to track their Google Analytics activity, identifying anomalous behavior in impressions and click-through rates for advertising units. Analyzing the Google Analytics data, Anodot identified a new trend where a portion of the traffic to one of PMC’s media properties came from a bad actor—referral spam that was artificially inflating visitor statistics.
For PMC’s analytics team, spotting this issue would have required that they already know what they were looking for in advance. After discovering this activity by using Anodot, PMC was able to block the spam traffic and free up critical resources for legitimate visitors. PMC could then accurately track the traffic that mattered the most, enabling PMC executives to make more informed decisions.
Monitor for conditions that could indicate a cyberattack or data breach in progress
Cyberattacks don’t happen in a vacuum; they need to use the underlying infrastructure of an organization’s network and other systems to establish their foothold and make their attack moves. By monitoring the operational metrics of these systems, companies can get alerts of early indicators of something being amiss.
Consider the massive Equifax data breach of 2017. Equifax confirmed that a web server vulnerability in Apache Struts that it failed to patch promptly was to blame for the data breach.
DZone explained how this framework functions. “The Struts framework is typically used to implement HTTP APIs, either supporting RESTful-type APIs or supporting dynamic server-side HTML UI generation. The flaw occurred in the way Struts maps submitted HTML forms to Struts-based, server-side actions/endpoint controllers. These key/value string pairs are mapped Java objects using the OGNL Jakarta framework, which is a dependent library used by the Struts framework. OGNL is a reflection-based library that allows Java objects to be manipulated using string commands.”
Had Anodot’s AI-powered analytics been in place at Equifax, it could have tracked the number of API Get Requests for user data and noticed an anomalous spike in requests, thus catching the breach instantly, regardless of the existing vulnerabilities. While Anodot Autonomous Detection is not a cybersecurity solution per se, it can complement an organization’s regular security stack by monitoring for unusual activity on the company’s systems and infrastructure.
Monitor the Performance of Telecom Systems
One area where this is becoming increasingly important is telecom services and 5G cellular networks. As 5G deployment scales up, an explosion of devices and new services will require proactive monitoring to help ensure guaranteed performance for mission-critical applications. With the complexity of 4G/5G hybrid networks and a host of new challenges for 5G networks, and as the network of interconnected devices grows, monitoring and maintenance become a greater challenge for operational teams. By correlating across metrics and performing root cause analysis, AI-powered analytics significantly decreases detection and resolution time while eliminating noise and false positives.
Get instant insights on cloud costs with Anodot’s CostGBT
-
Simplicity: Users can ask questions about their cloud costs in chat, receiving accurate and relevant insights.
-
Actionable Insights: CostGPT provides strategic optimization suggestions, along with further inquiries and commands, to help customers thoroughly understand their cloud expenditure.
-
Proactive Decision-Making: By leveraging search data, CostGPT enables organizations to make informed decisions on cloud resource allocation, preventing unnecessary costs and optimizing resource utilization.
-
Real-Time Data Visualizations: CostGPT offers intuitive visualizations for exploring and analyzing cloud costs, allowing users to plan and make informed expenditure decisions.
In Summary
There are many uses cases for and benefits of AI-powered analytics. Anodot’s Autonomous Detection business monitoring solution and CostGPT allows companies to automatically find hidden signals in multitudes of metrics, in real-time, so that action can be taken immediately to minimize the negative impacts of issues in the underlying systems. This can preserve revenues and reduce the cost of lost opportunities.
Related Guides:
- Top 13 Cloud Cost Optimization: Best Practices for 2025
- Understanding FinOps: Principles, Tools, and Measuring Success
Related Products:
Start Reducing Cloud Costs Today!
Connect with one of our cloud cost management specialists to learn how Anodot can help your organization control costs, optimize resources and reduce cloud waste.


