It’s estimated that 25 percent of the world’s population already shops online with increasingly more customers participating in eCommerce daily, expecting to reach 2.14 billion people by 2021. So, it should be no surprise that it’s essential for online stores to run smoothly, including having prices in order. It may sound basic, but simple computer glitches can cause pricing errors that may excite consumers, but cause major problems down the line.
For example, on New Year’s Day, Cathay Pacific Airline accidentally priced a luxury flight from Vietnam to New York City at a $15,000 discount due to an online glitch. The business class journey cost just $675 rather than its usual $16,000 price. Ultimately, the airline decided to honor the error as a New Year’s Day ‘special’.
Similar apparent ‘deals’ happen very frequently. Amazon accidentally slashed the price on a popular steam mop by 90 percent on a ‘deal of the day’ glitch. And PC World sold a $3500 TV for just $300 due to an online price glitch. These are perfect examples of delayed business insights that can cost companies millions of dollars.
There’s a growing disconnect between the capabilities businesses need from their analytics and what traditional tools actually provide. Companies often rely on traditional Business Intelligence (BI) and monitoring tools to handle what has now become massive volumes of live streaming data. Compared with AI-based anomaly detection, these dashboards, reports and static thresholds can prolong time to detection and time to resolution in several key ways:
Heavy Maintenance
In the business world, millions of metrics may be collected. Humans typically will prioritize which metrics to track and which to ignore.
Considering the Cathay Pacific example, the company most likely chose not to monitor the purchase behavior for that specific flight. Since they (and most other eCommerce businesses) need to monitor thousands of products, they cannot set alerting thresholds for every one of them.
Differentiating between Normal and Abnormal Metrics
Let’s take a look at the metrics that you do choose to track: you need to create dashboards and reports on demand. However, these are created based on what you want to measure. What happens when you don’t know or are missing a metric?
Accurate alerts from these metrics are very difficult to achieve: it requires setting static thresholds. How can you determine what is normal behavior and what is not? Metric normal behavior can change dramatically over time – during the day, week etc. This factor results in numerous false positive alerts.
Business Insight Latency
Most significantly, traditional monitoring tools have inherent latency issues. Anomalies are not detected in real time; discovery is left to the off-chance that someone notices abnormal behavior on a dashboard, and by that point it could be too late. Referring again to the Cathay Pacific example: although the problem was indeed discovered, this occurred only a few hours later, and only after hundreds of people had already purchased the massively discounted flight.
From Reactive to Proactive Monitoring
So how can you change a reactive business monitoring method to a proactive one? The answer is by using an automated, real-time anomaly detection system. This method will allow your business to track millions of metrics with minimal maintenance, get accurate alerts based on determining normal metric behavior vs. understanding of abnormal behavior, and gain real-time insights when you really need them.
With an automated anomaly detection system, you can actually identify issues as they happen, before they impact your business dramatically.
Real-time anomaly detection could have assisted Cathay Pacific in the following ways:
1. Automatically learn normal behavior
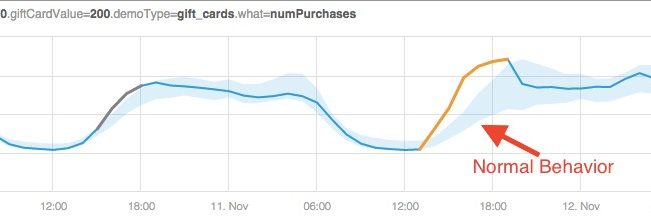
The system will learn the normal behavior for “number of $16,000 business flight purchases” and “revenue from $16,000 business flight” metrics. The graph below shows a typical eCommerce retailer using Anodot’s automated anomaly detection. Notice that the behavior is seasonal. This means that it changes at different times of the day, on different days such as holidays or weekends. As you can see in the shaded area in the graph, an automated machine learning system can cope with dynamic behavior.
2. Quickly identify and alert to abnormal activity
The image below indicates how an anomaly detection-based system would discover the abnormal behavior much earlier than one based on static thresholds.
3. Metric correlation to gain the right context
By correlating multiple metrics automatically, the real-time anomaly detection system can send one alert with metrics that are more meaningful together. In this way, the operator would have seen immediately that there was unusual activity around the “number of $16,000 business flight purchases.”
Without the proper context, a steep increase in number of gift cards purchased would be perceived as a positive incident. However, a concurrent drop in the “revenue from $16,000 business flight” metric (see image below) would immediately indicate that something is going wrong; and would have dramatically reduced the time to resolution.
To summarize, using an automated real-time analytics solution, Cathay Pacific and other eCommerce businesses could have resolved price glitches much faster. This scenario is just one of many in which an anomaly detection system would have been effective. Anomaly detection helps companies gain critical real-time business insights and optimize revenue.
I recently spoke about automated anomaly detection more in-depth at the CTO Summit in San Francisco. Feel free to browse through the slides and learn about how it works.


