
For modern businesses faced with increasing volumes and complexity of data, it’s no longer efficient or feasible to rely on analyzing data in BI dashboards. Traditional dashboards are great at providing business leaders with insights into what’s happened in the past, but what if they need actionable information in real time? What if they want to use their data to estimate what may happen in the future?
Companies are taking notice. In a survey by Deloitte, 67% of executives said they were not satisfied with the benefits of their existing tools and resources. The highest-performing companies use data science empowered by AI/ML to bridge that gap.
The Limitations of Dashboards
For today’s data-driven companies, there are thousands of metrics that can be gathered and collected to gain insights into business performance. As relevant data points grow exponentially, it becomes challenging to use traditional dashboards to track these metrics and make informed timely decisions. Here are some of the most significant limitations of conventional BI dashboards:
Lack of real-time anomaly detection prevents proactive incident management
Most BI dashboards do not show data in real-time, and when they do, there are so many metrics cluttering screens that users can easily miss the most critical information. Timely intervention is crucial to modern businesses, which often run tightly integrated ecosystems of applications and infrastructure that stretch across multiple departments and process enormous amounts of data.
For example, leading adtech platform, Rubicon Project, fields trillions of bid requests per month and needs to analyze data points from millions of potential sources. In an environment like that, every minute can have significant impact. They found that traditional dashboards failed to deliver the real-time detection and response capability necessary to intervene before anomalies impacted their bottom line.
According to Gartner, downtime costs the average business more than $300K per hour. Enterprises need the capability to manage these systems proactively rather than reactively.
Over-reliance on historical data
Most companies configure and use traditional dashboards to track KPIs and other critical business metrics to understand how their business and systems perform. One factor often missed by decision-makers is that the data they view in traditional dashboards describes what has already happened and might not be a reliable indicator of what will happen in the future.
Moving from descriptive to predictive modes of thinking requires a deep understanding of the business context and critical thinking, which can be challenging for any person, or even a dedicated team, given the diversity of the data set, new trends, and fluctuating behaviors.
Missing small incidents that have a negative impact
Some incidents are hard to spot, but that doesn’t mean they won’t significantly impact the business. When undetected, hard-to-spot incidents can accumulate and can end up having the same impact as more prominent issues.
A typical scenario involves incidents affecting only one business component. These isolated issues can easily get lost in KPIs based on a calculated average of multiple metrics. For example, a server cluster might be displaying a 99.99% average uptime. If one server in that cluster is experiencing an anomalously high amount of downtime, it could remain invisible to the dashboard. A single server is a small data point in a data center with thousands of servers, but it could be vital depending on what that server is running.
CEO dashboards lack correlation
When it comes to business intelligence and gaining real, actionable insights, choosing which metrics to include is more art than science. CEO dashboards only answer the questions that users who configure the system think to ask, but actionable insights can be present in any metric. This limitation is even more problematic because some insights can only be correlated when data is considered across multiple metrics, even if there is no apparent connection.
For data to be actionable, it needs to have a holistic view of all relevant information and the impacts of the decision across the business. CEO dashboards fall short when missing data links delay or lead to misinformed decisions that harm the organization.
Cluttered dashboards and false positives
Sometimes, even with all the necessary information, BI dashboards struggle to present a coherent picture. With CEO dashboards, in particular, there’s some guesswork in determining ahead of time what information is important enough to display in the limited real estate available on the screen. When alerts start to pop up, it can be difficult to tell which data is necessary or worth ignoring. The sheer volume and increasing complexity of data can quickly overwhelm the dashboard interface, making it much harder for business leaders to consume in a timely, accurate manner.
Lack of intelligent prioritization
Collecting thousands of events or alerts every minute from your applications and infrastructure, and presenting that data in a dashboard isn’t analytics. Users apply filters on this data, performing their own analysis and work.
Deriving intelligence from data shouldn’t require an end user to define what to look for, or where, or what are the most critical KPIs, or what normal or abnormal is. This is not intelligence because a user is telling the dashboard exactly what data to show.
Leverage the Power of AI Analytics
Business strategy is only effective if empowered with enough intelligence and agility to outmaneuver the competition. Traditional dashboards don’t provide insight fast enough in today’s data-driven world, and when a business can lose hundreds of thousands of dollars in a single hour due to a pricing glitch on an e-Commerce site, the stakes are too high.
Companies need real-time, actionable insights across all data metrics relevant to performance. The best-performing businesses leverage BI solutions empowered by AI and machine learning to eliminate the need for human correlation across the millions of critical metrics needed to understand business and system performance.
Grouping and correlating multiple anomalies by design, Anodot’s AI-powered analytics elevates the essential insights first. By learning the normal behavior of millions of metric’s, Anodot detects only the most impactful incidents and alerts relevant teams at the start.
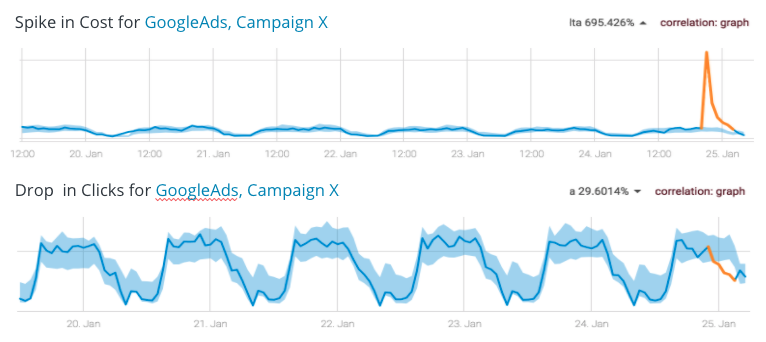
In the example above, an online business was alerted immediately to a spike in cost for a Google Ad campaign. It was an incident so granular that it would have been overlooked for days using traditional monitoring tools.
As an AI analytics solution with anomaly detection capabilities, Anodot can monitor millions of metrics at a granular level, giving both the detail and scale needed to identify the business incidents that matter. Automated anomaly detection and contextualized alerts break free talented specialists and business leaders from the pain of manually monitoring dashboards so they can step in when it counts.